The price of Ripple’s XRP cleared an important resistance line and reached a new monthly high on May 30.
However, despite this breakout, the price action and wave count suggest that a local top may be in place, hence predicting a future price decrease. Additionally, the release of 500 million XRP tokens from an escrow could create additional selling pressure.
Ripple Price Clears Crucial Resistance
The price of XRP has decreased below a descending resistance line since March 28. This indicates that the price is in a short-term correction.
However, the price broke out from the line on May 26, confirming that the correction is complete. The breakout led to a high of $0.53 on May 30.
Despite the breakout, the price was rejected by the 0.618 Fib retracement resistance level at $0.52 (red icon). It has fallen since.

Према теорији нивоа Фибоначијевог ретрацемента, након значајне промене цене у једном правцу, очекује се да ће се цена делимично вратити на претходни ниво цене пре него што настави у истом правцу.
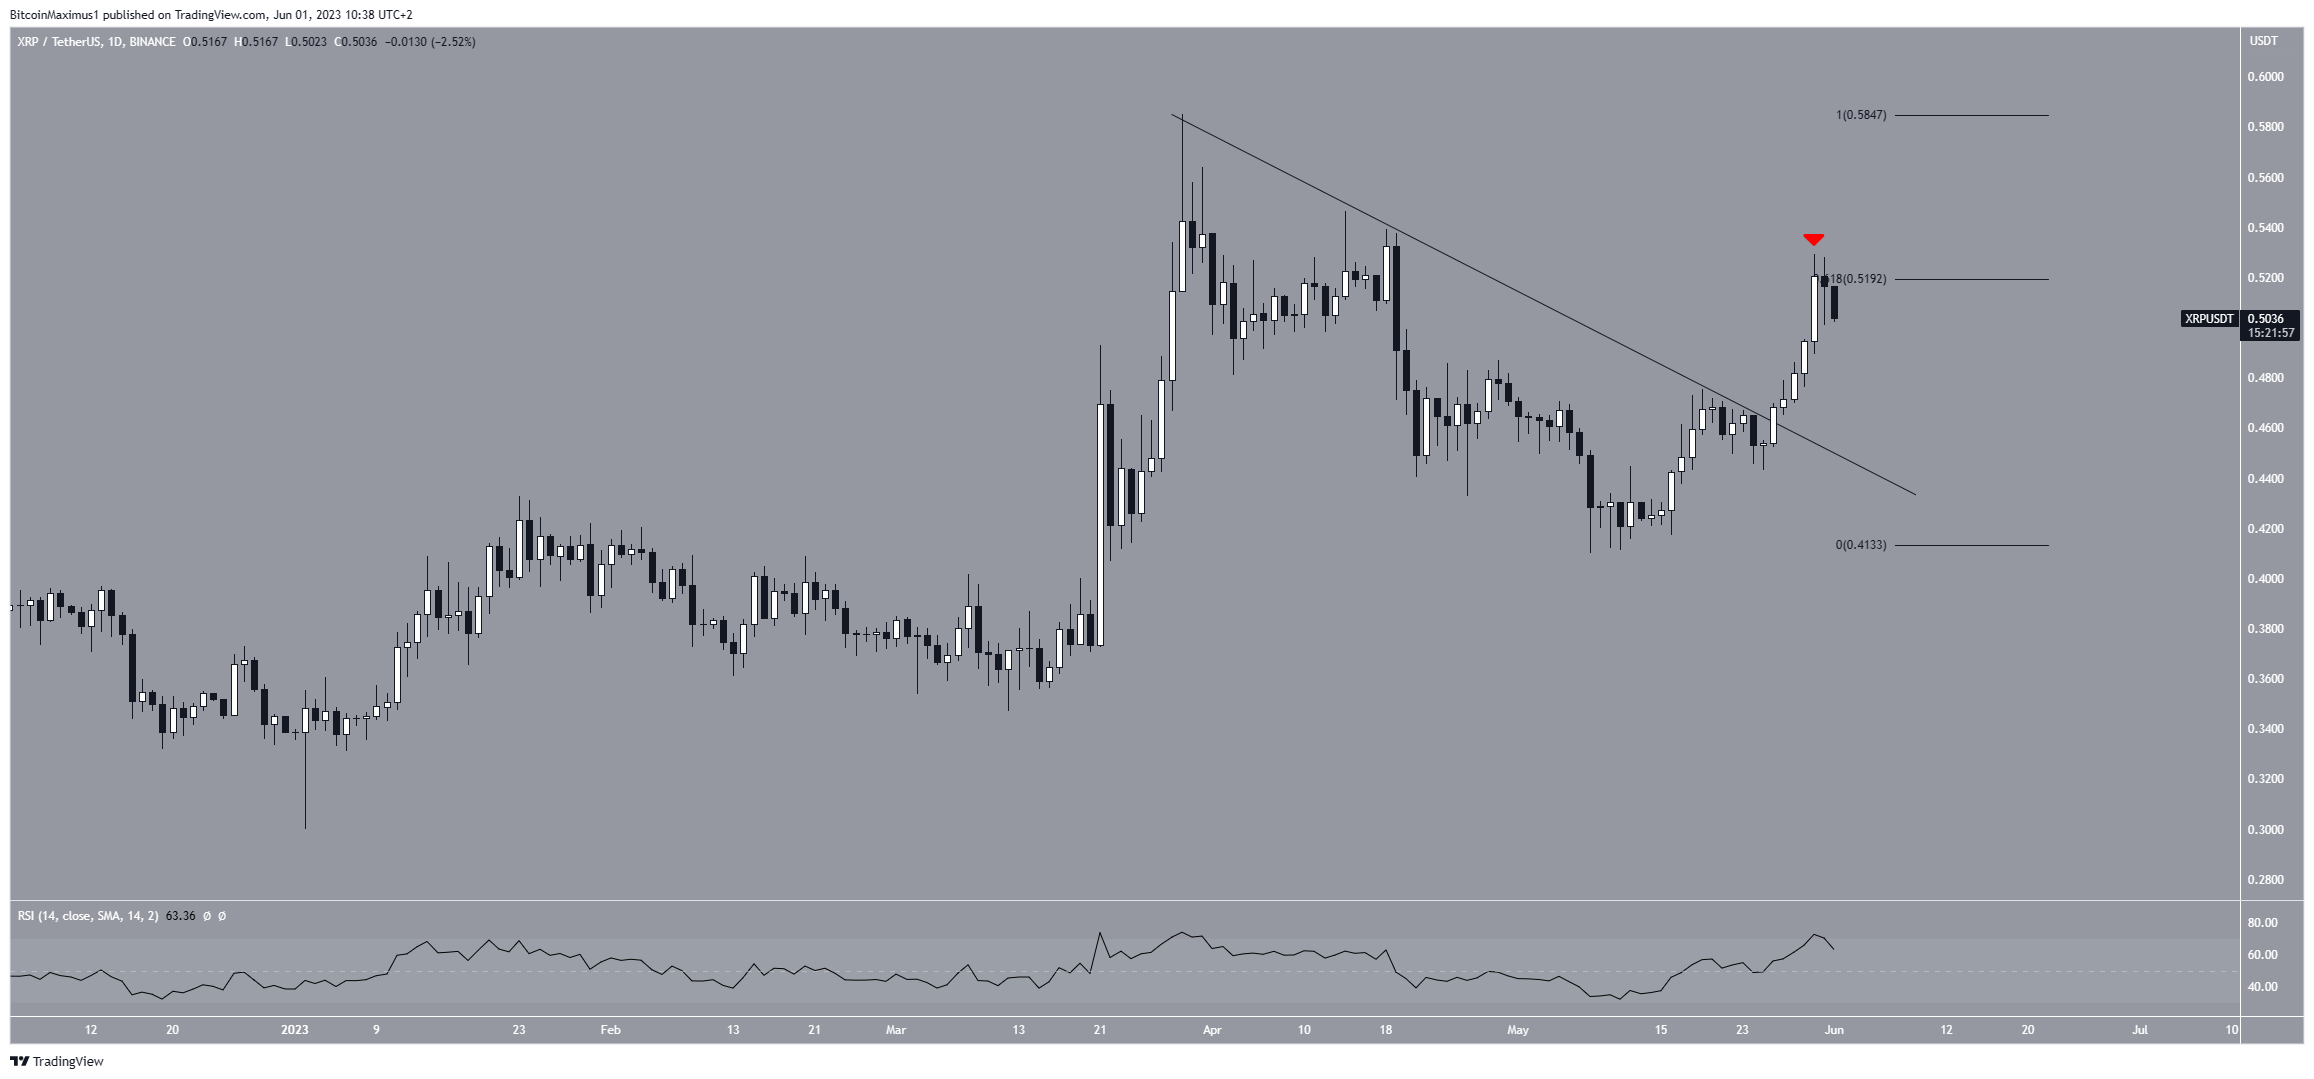
The Relative Strength Index (RSI) indicator supports the legitimacy of the breakout. By using the RSI as a momentum indicator, traders can determine whether a market is overbought or oversold and decide whether to accumulate or sell an asset.
Ако је РСИ читање изнад 50 и тренд је узлазни, бикови имају предност, али ако је читање испод 50, тачно је супротно.
However, while the indicator is above 50 and still increasing, it reached overbought territory. This is an area where local tops are often reached.
XRP Price Prediction: Has the Price Topped?
Based on a technical analysis within a short-term four-hour time frame, the ongoing rebound in XRP is merely a temporary rally and will be followed by another decline. This analysis suggests a bearish forecast for XRP’s price, which has possibly reached its local top.
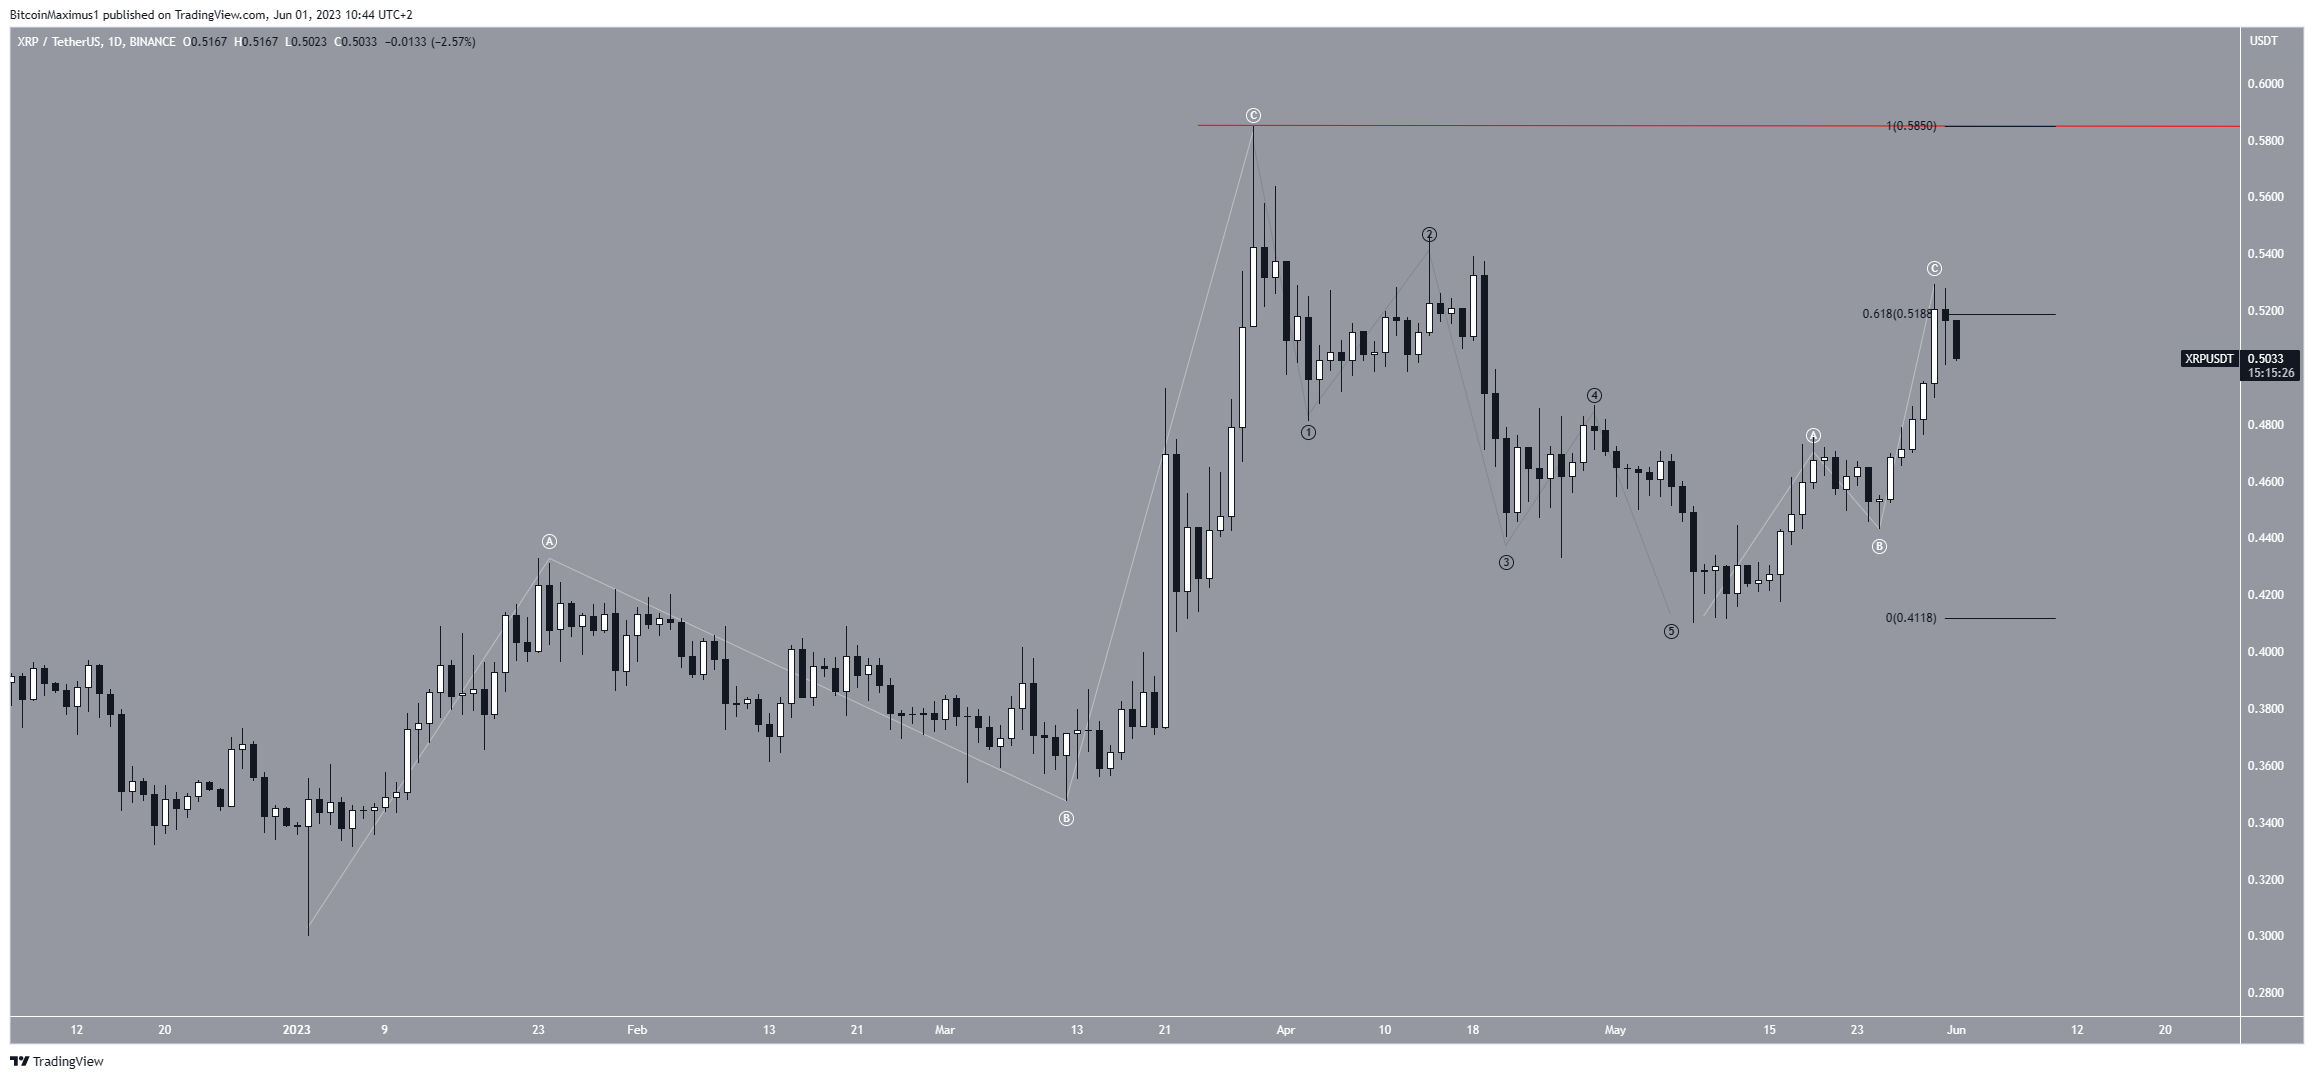
The primary justification for this outlook is the wave count, which strengthens the notion of a downward trend. Technical analysts employ the Elliott Wave theory to determine the direction of trends by examining recurring long-term price patterns and investor psychology.
According to the wave count, the price of XRP has concluded a five-wave decline (indicated in black). This confirms a bearish trend. Furthermore, the decline followed an upward corrective labeled as A-B-C, further supporting this possibility.
If this long-term count is correct, the breakout from the descending resistance line is only part of another A-B-C correction. The 0.618 Fib retracement level rejecting the price supports this possibility.
So, the count suggests that a local top is in and a decrease to $0.34 will follow.
Ослобађање 500 милион КСРП токена today supports this possibility. A release of this magnitude could create massive selling pressure, in turn causing a sharp downward movement.
Despite this bearish XRP price prediction, an increase above the yearly high of $0.58 will mean the trend is still bullish. In that case, the XRP price could increase to the next resistance at $0.90.
За најновију анализу тржишта криптовалута БеИнЦрипто кликните овде
Одрицање од одговорности
У складу са смерницама пројекта Труст, овај чланак о анализи цена је само у информативне сврхе и не треба га сматрати финансијским или инвестиционим саветом. БеИнЦрипто је посвећен тачном, непристрасном извештавању, али тржишни услови су подложни променама без претходне најаве. Увек спроведите сопствено истраживање и консултујте се са професионалцем пре него што донесете било какве финансијске одлуке.
Source: https://beincrypto.com/xrp-price-steady-250m-escrow-release/