The bitcoin market has been in a blood bath after registering a new all-time high at the $69K level, followed by a period of moving inside a bearish descending channel. The only question now is if $20K will hold.
Техничка анализа
By Схаиан
Дневни графикон
Currently, Bitcoin’s price ranges above the significant support level at $20K, which is also 2017’s all-time high. Based on the market sentiment and a clear divergence between the price and the RSI indicator, a short-term rebound followed by consolidation at this price region is the most expected scenario.

Nevertheless, the price would need to break above the $32K level and the 50-day and 100-day moving averages to make a bullish reversal respectable.
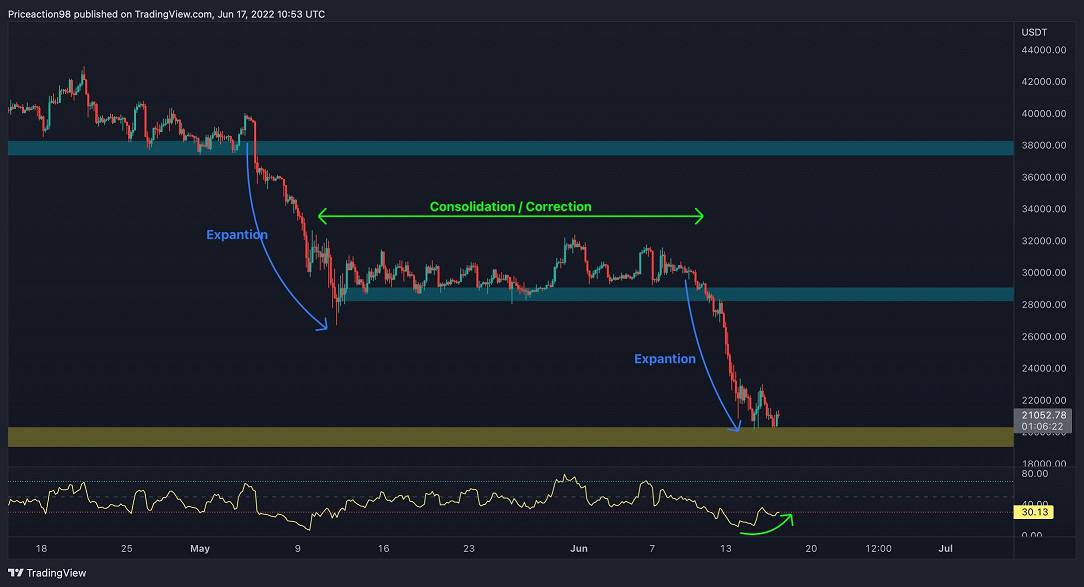
4-сатни графикон
The market usually has two phases: an expansion phase in which the price moves sharply in either direction without particular corrections and a consolidation/correction phase in which the price usually ranges and manipulates the players.
After a boring mid-term consolidation phase, the price has entered an expansion and experienced a sharp drop to the $20K support level. On the other hand, the bearish momentum has decreased, and Bitcoin has found a short-term bottom at around $20.5K. Considering the divergence between the price and the RSI metric in the 4-hour timeframe and the crucial support level of $20K, a short-term consolidation phase followed by liquidations in the futures market is the most likely scenario for the price. In any case, if the price breaks below $20K, the next support would be found at $17K.
In case of a bullish rebound and a surge, the $29K and $37K price levels will be the primary resistance levels.
Онцхаин Аналисис
Би Схаиан
Over the last two years, the most pervasive sentiment in international affairs has been “uncertainty.” Several unstable phases have occurred in the previous two years due to a worldwide pandemic, inflation-related concerns, the Federal Reserve’s monetary policies, and, most recently, a geopolitical conflict.
The figure below depicts a large picture of Bitcoin’s supply dynamics Based on the CryptoQuant data. Realized Cap – UTXO Age Bands (%) is a metric that depicts coin clusters based on their lifespan (the last time they were moved) and their share of the total realized cap. As specified in the chart’s narrative, coins varying in age from 3 months to 10 years are illustrated and classified by distinct colors.
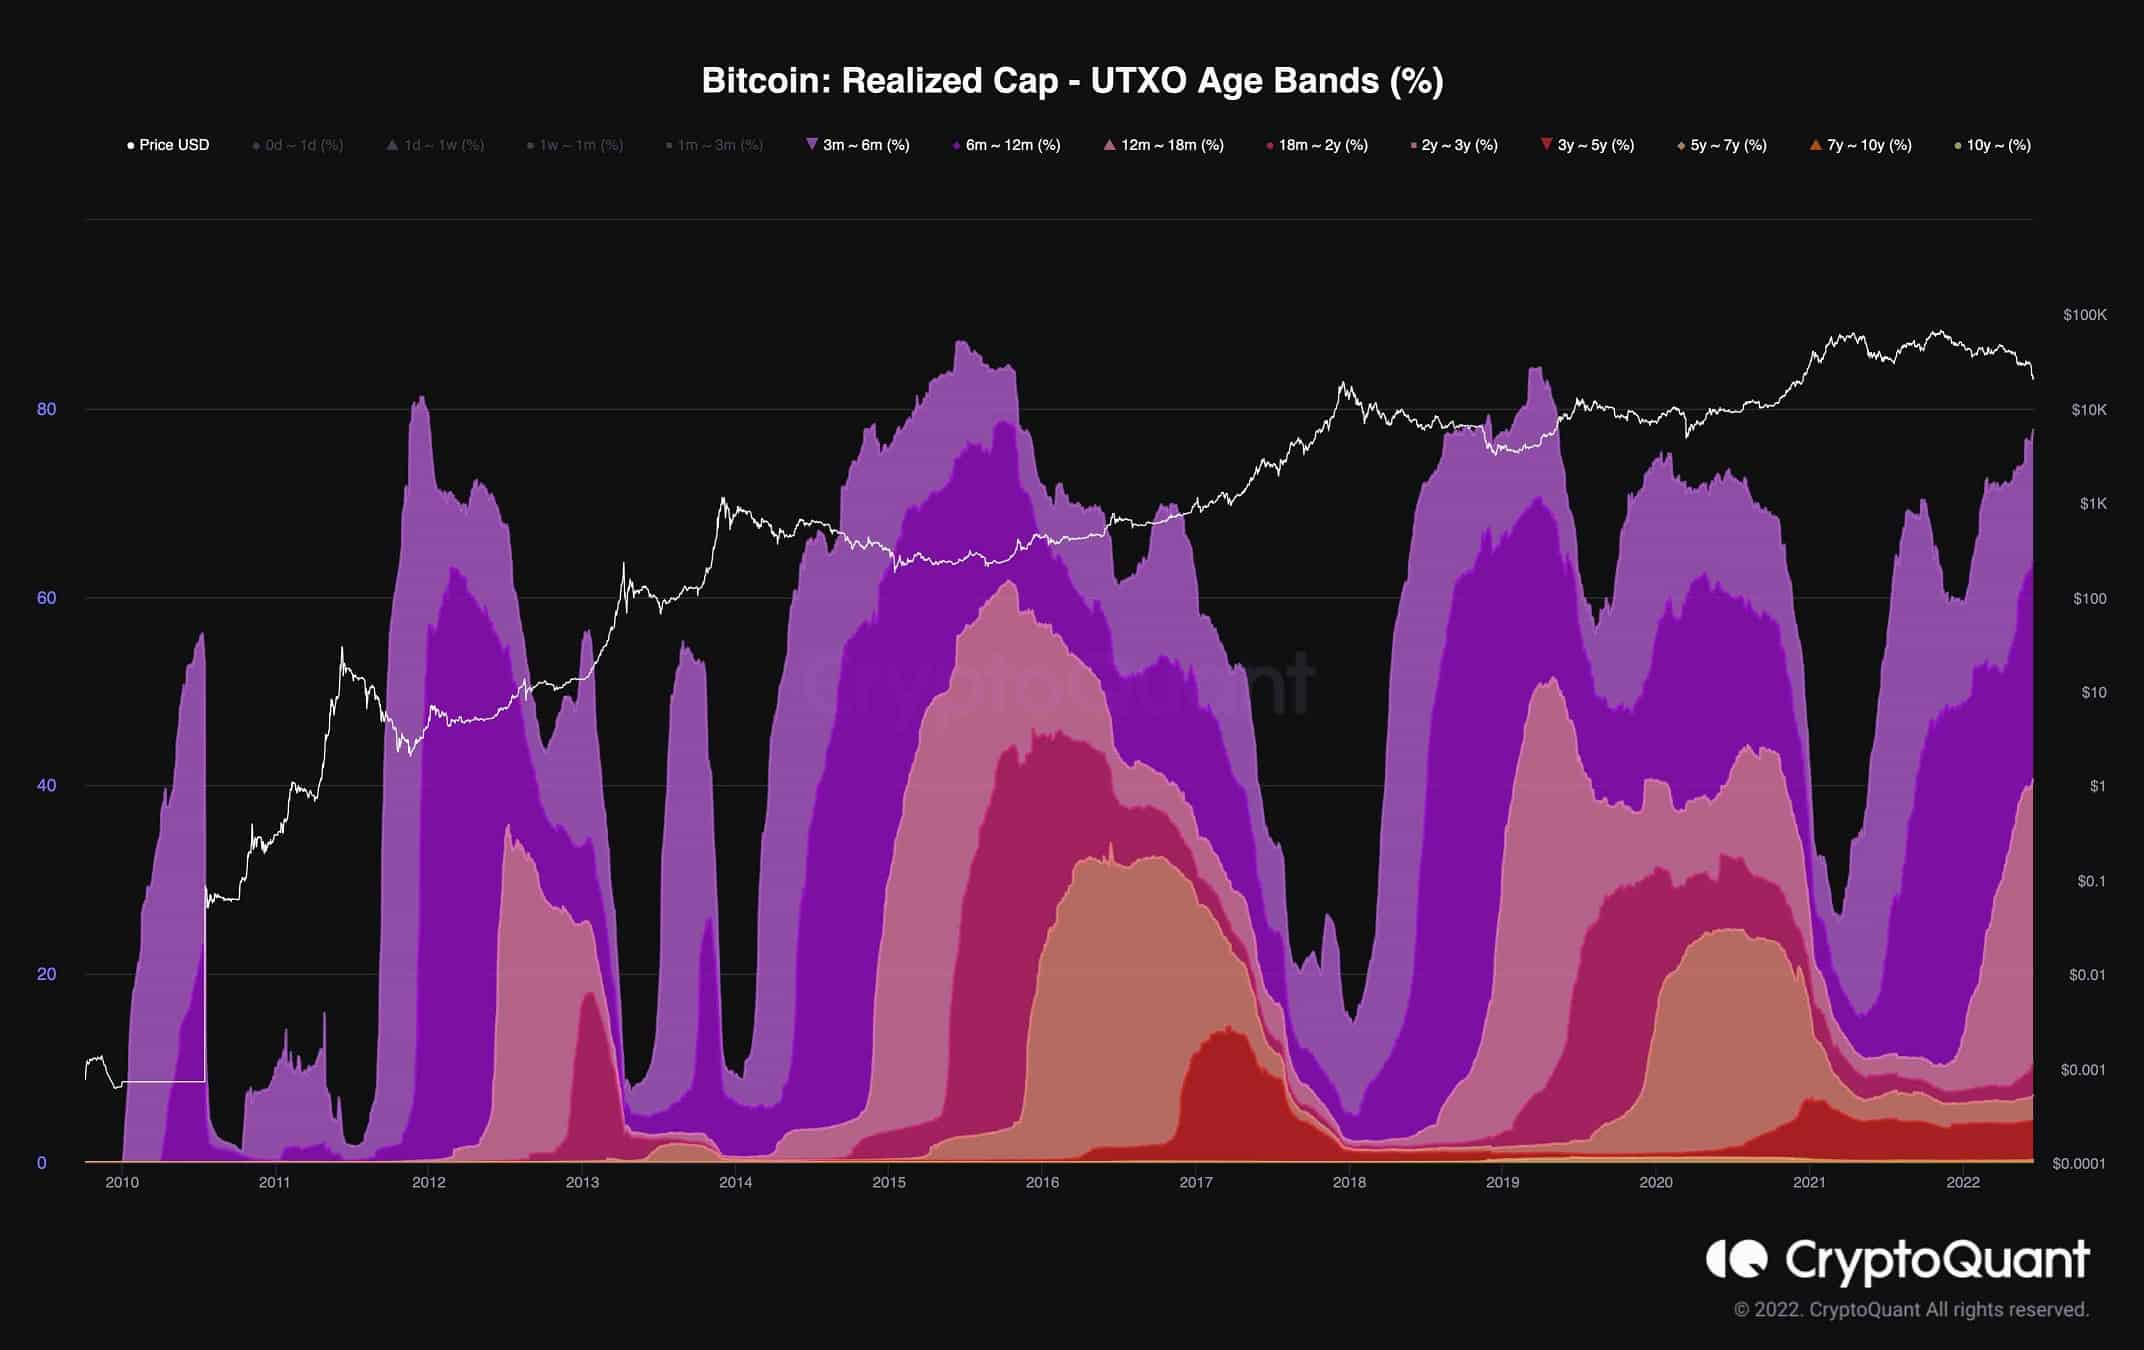
In summary, a spike in these age bands signifies HODLing and accumulation among long-term holders, whereas a reduction shows selling and distribution. The market is in a period of accumulation, with the number of coins that have moved in the last three months steadily increasing.
Бинанце бесплатно $100 (ексклузивно): Користите ову везу да се региструјете и добијете 100 $ бесплатно и 10% попуста на Бинанце Футурес првог месеца (услови).
ПримеКСБТ специјална понуда: Користите ову везу да се региструјете и унесете ПОТАТО50 код да бисте добили до 7,000 долара на своје депозите.
Изјава о одрицању одговорности: Подаци који се налазе на ЦриптоПотато-у су подаци писаца. Не представља мишљење ЦриптоПотата о томе да ли куповати, продавати или задржати било каква улагања. Саветујемо вам да спроведете сопствено истраживање пре него што донесете било какве одлуке о инвестирању. Користите достављене информације на сопствени ризик. Погледајте одрицање за додатне информације.
Крипто валута од ТрадингВиев.
Source: https://cryptopotato.com/bitcoin-facing-20k-this-is-what-will-happen-if-it-breaks-down-btc-price-analysis/