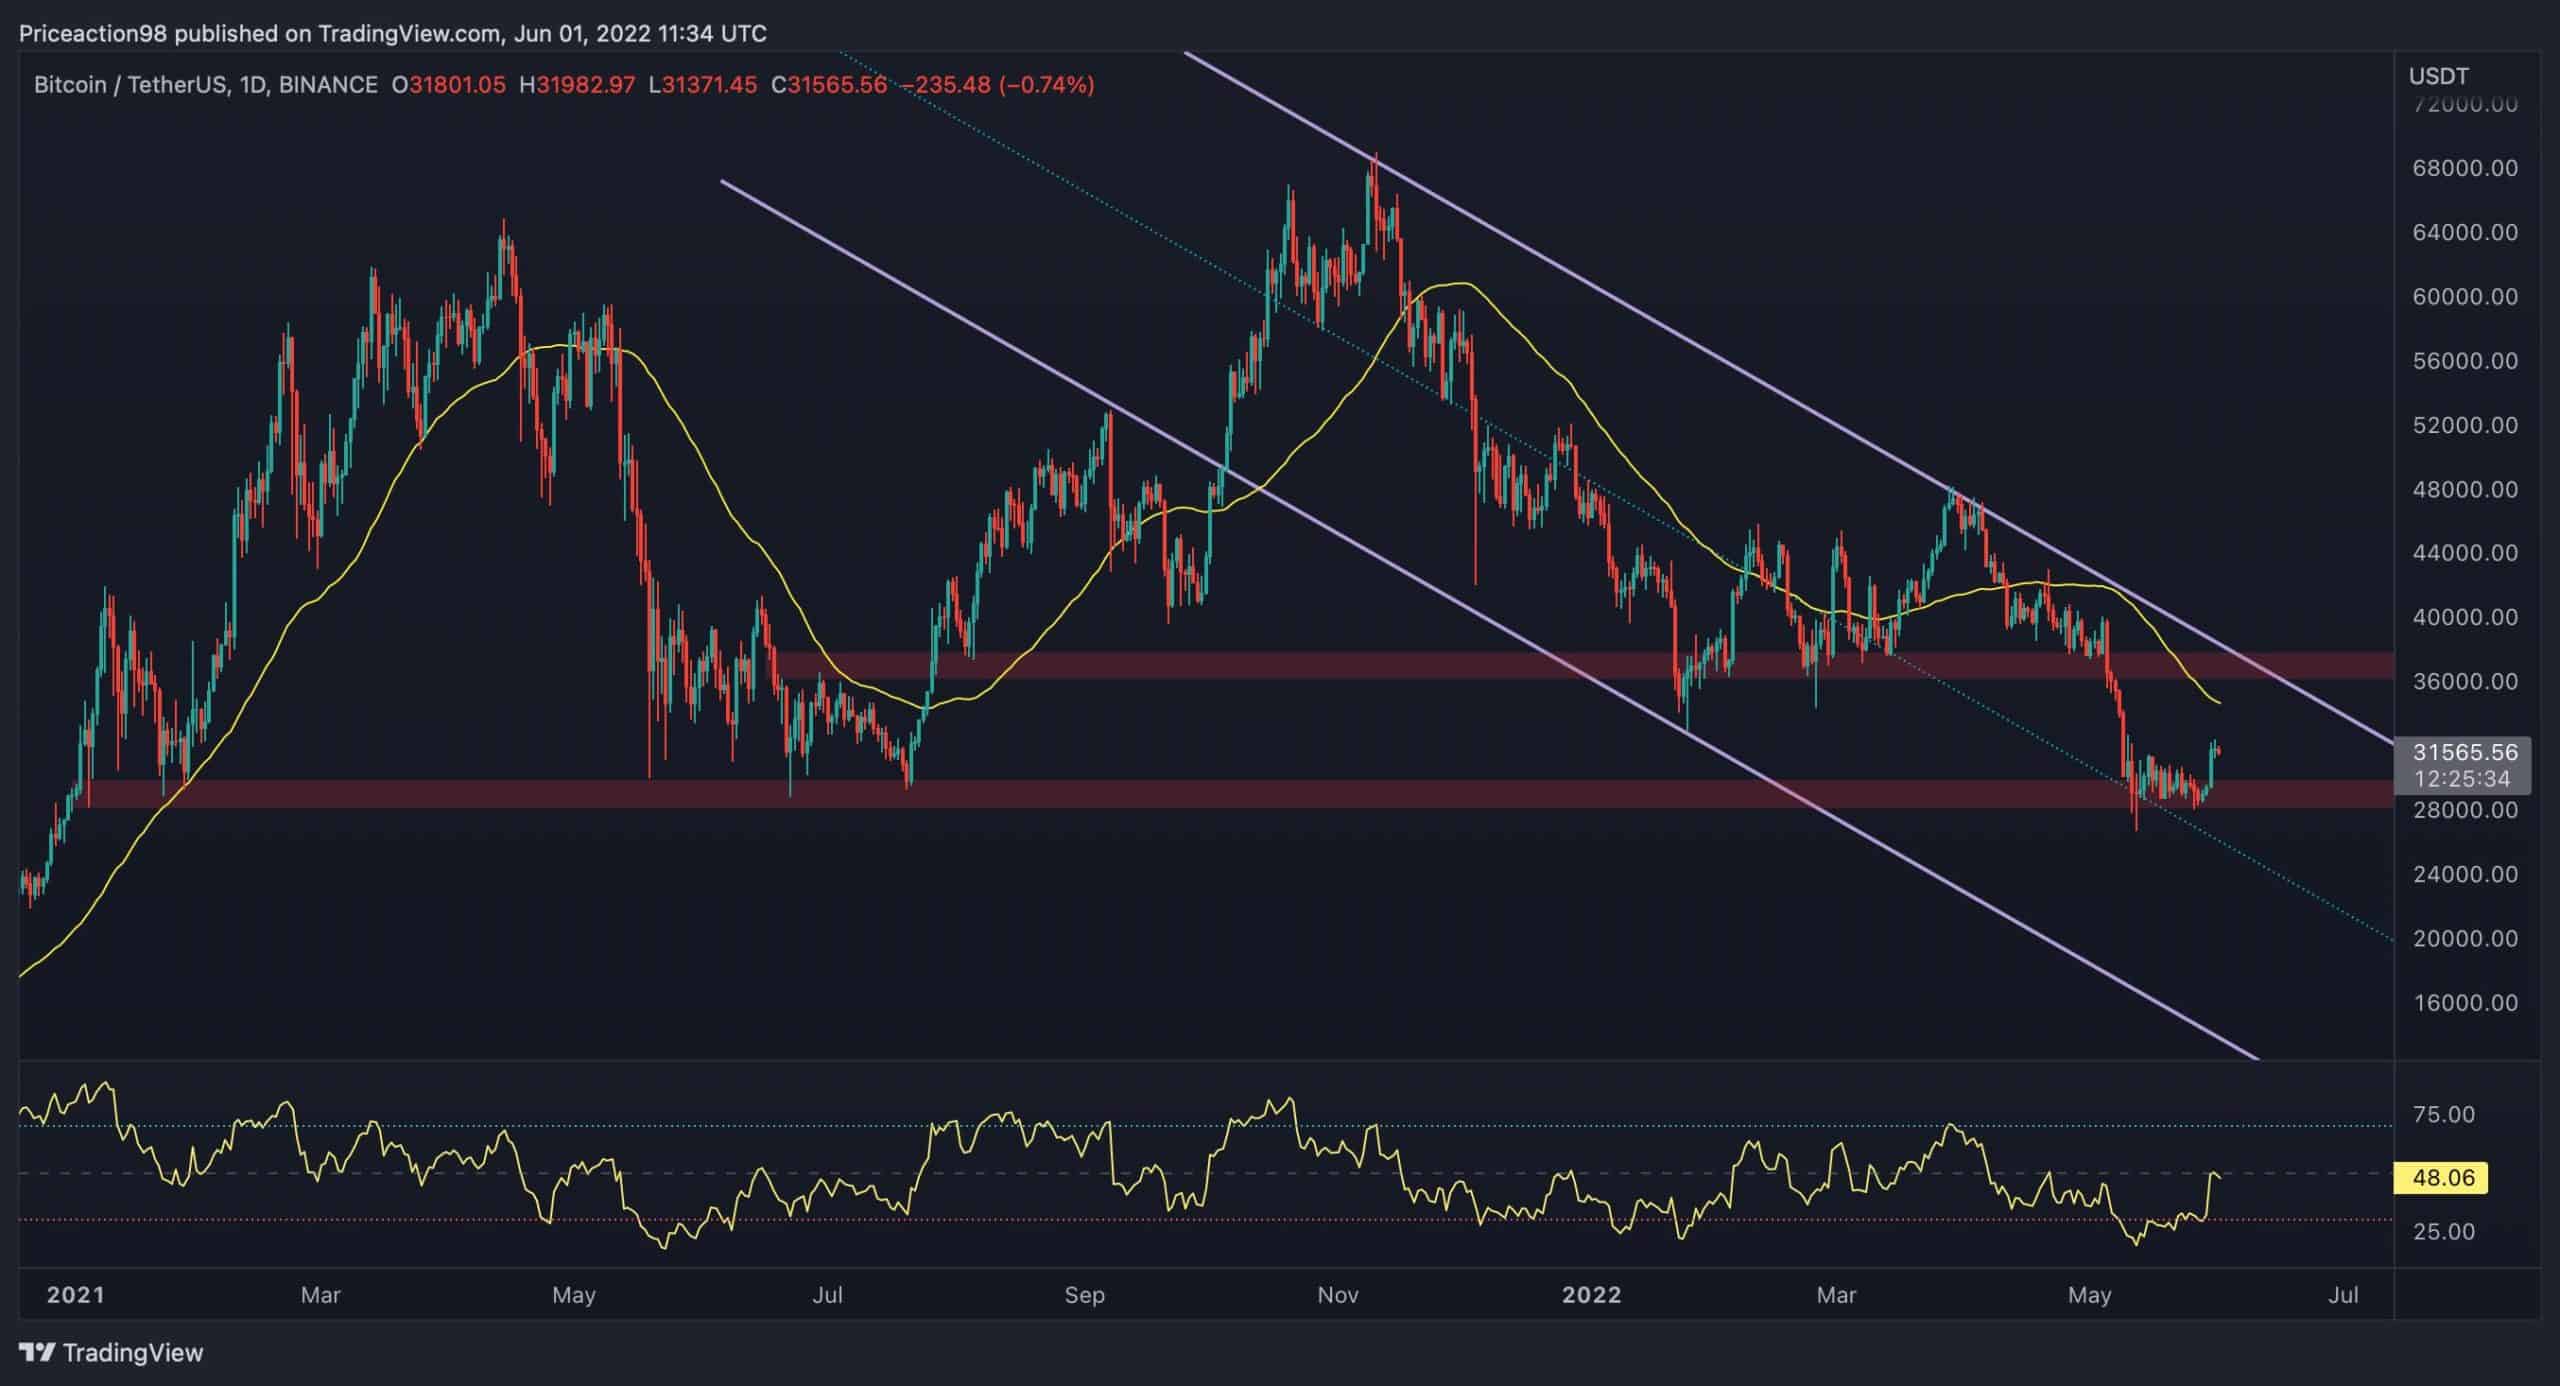
The $28K – $30K decisive demand zone and the channel’s mid-line have served as reliable support for the price in the past few days, leading to a 13% rebound. In this analysis, we take a look at the possible scenarios going forward.
Техничка анализа
By Схаиан
Дневни графикон
In case of a bullish rally, the following primary resistance levels for bitcoin will be $34K and $37K. The RSI has broken above its descending trendline and is steadily climbing around 50%. At the same time, the breakout acted as a catalyst, pushing bitcoin’s price higher. Nevertheless, an RSI value of 50 implies an equilibrium between bulls and bears in terms of market control.

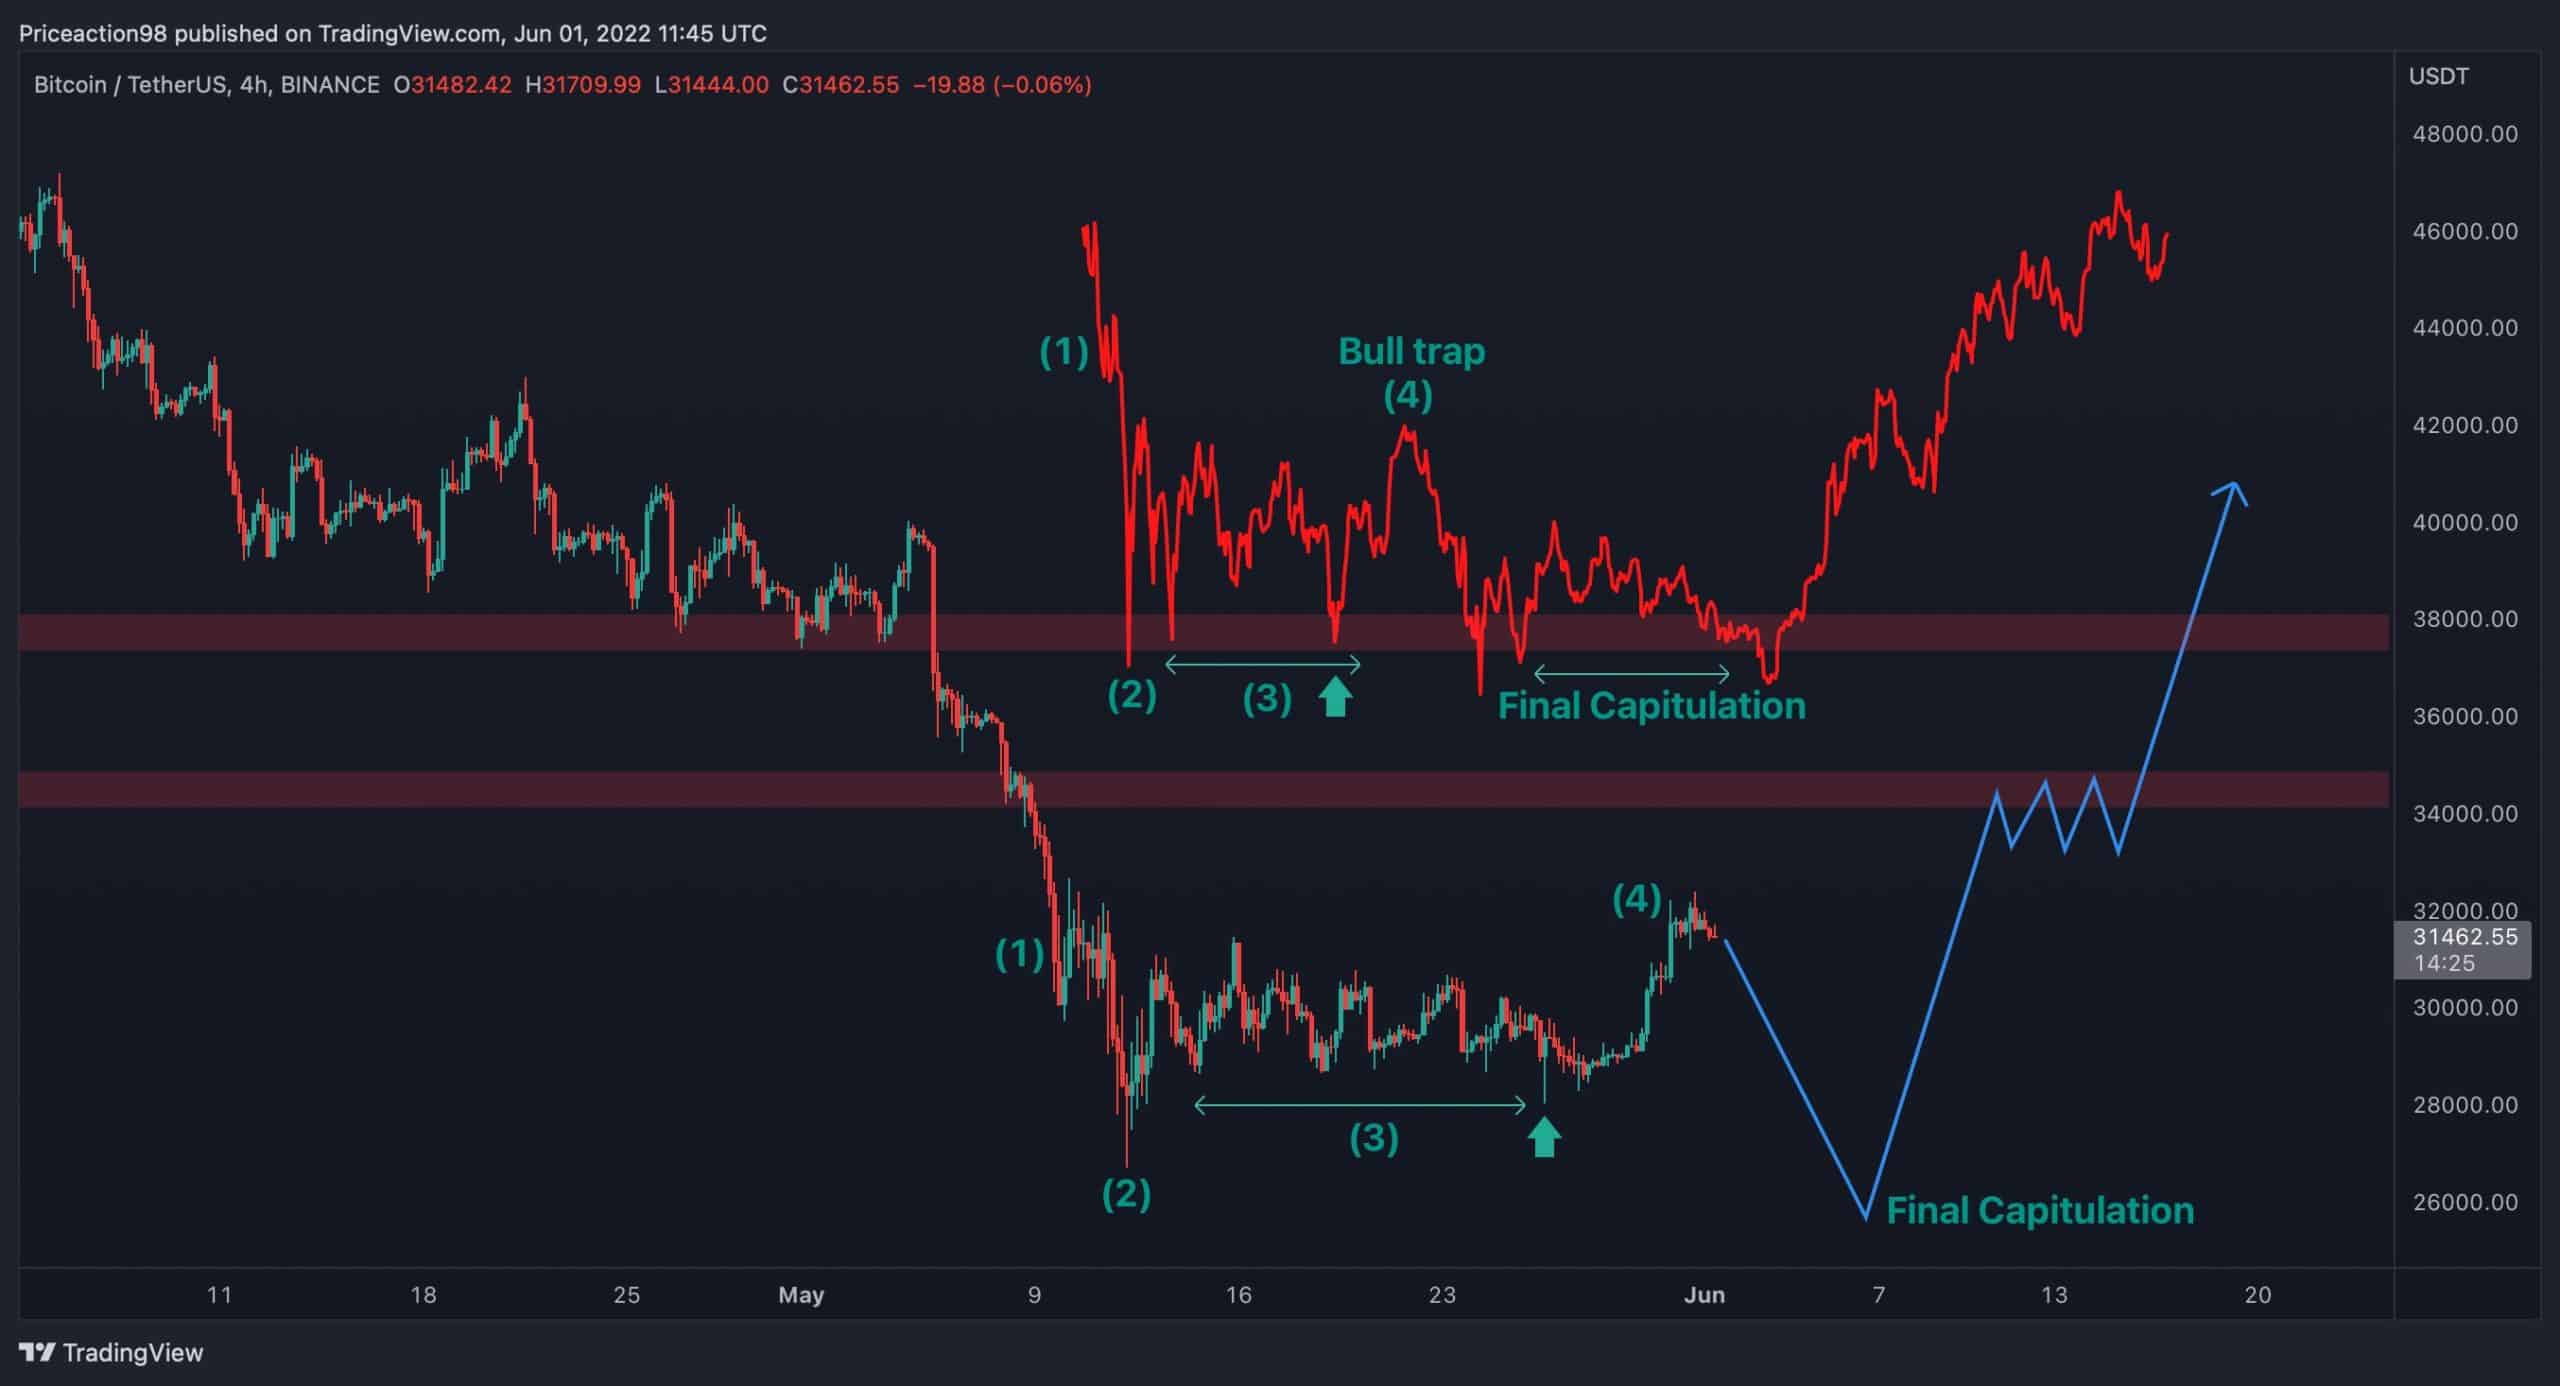
4-сатни графикон
This chart demonstrates a red pattern consisting of Bitcoin’s price action back in May 2021 when it crashed to $29K, plus its current price.
In May 2021, a clear Wyckoff accumulation pattern was seen, which led to a rally towards a new ATH at around $65K. The current price pattern is similar to June 2021’s capitulation/accumulation event.
Currently, Bitcoin has rallied and broke the prior equal highs grabbing the resting liquidity (Buy stops). However, the most probable scenario seems to be a cascade to register a new lower low, completing the Wyckoff pattern and the final capitulation in the mid-term. When the final capitulation occurs, the market can expect a recent healthy bullish move toward higher price channels.
Онцхаин Аналисис
By Схаиан
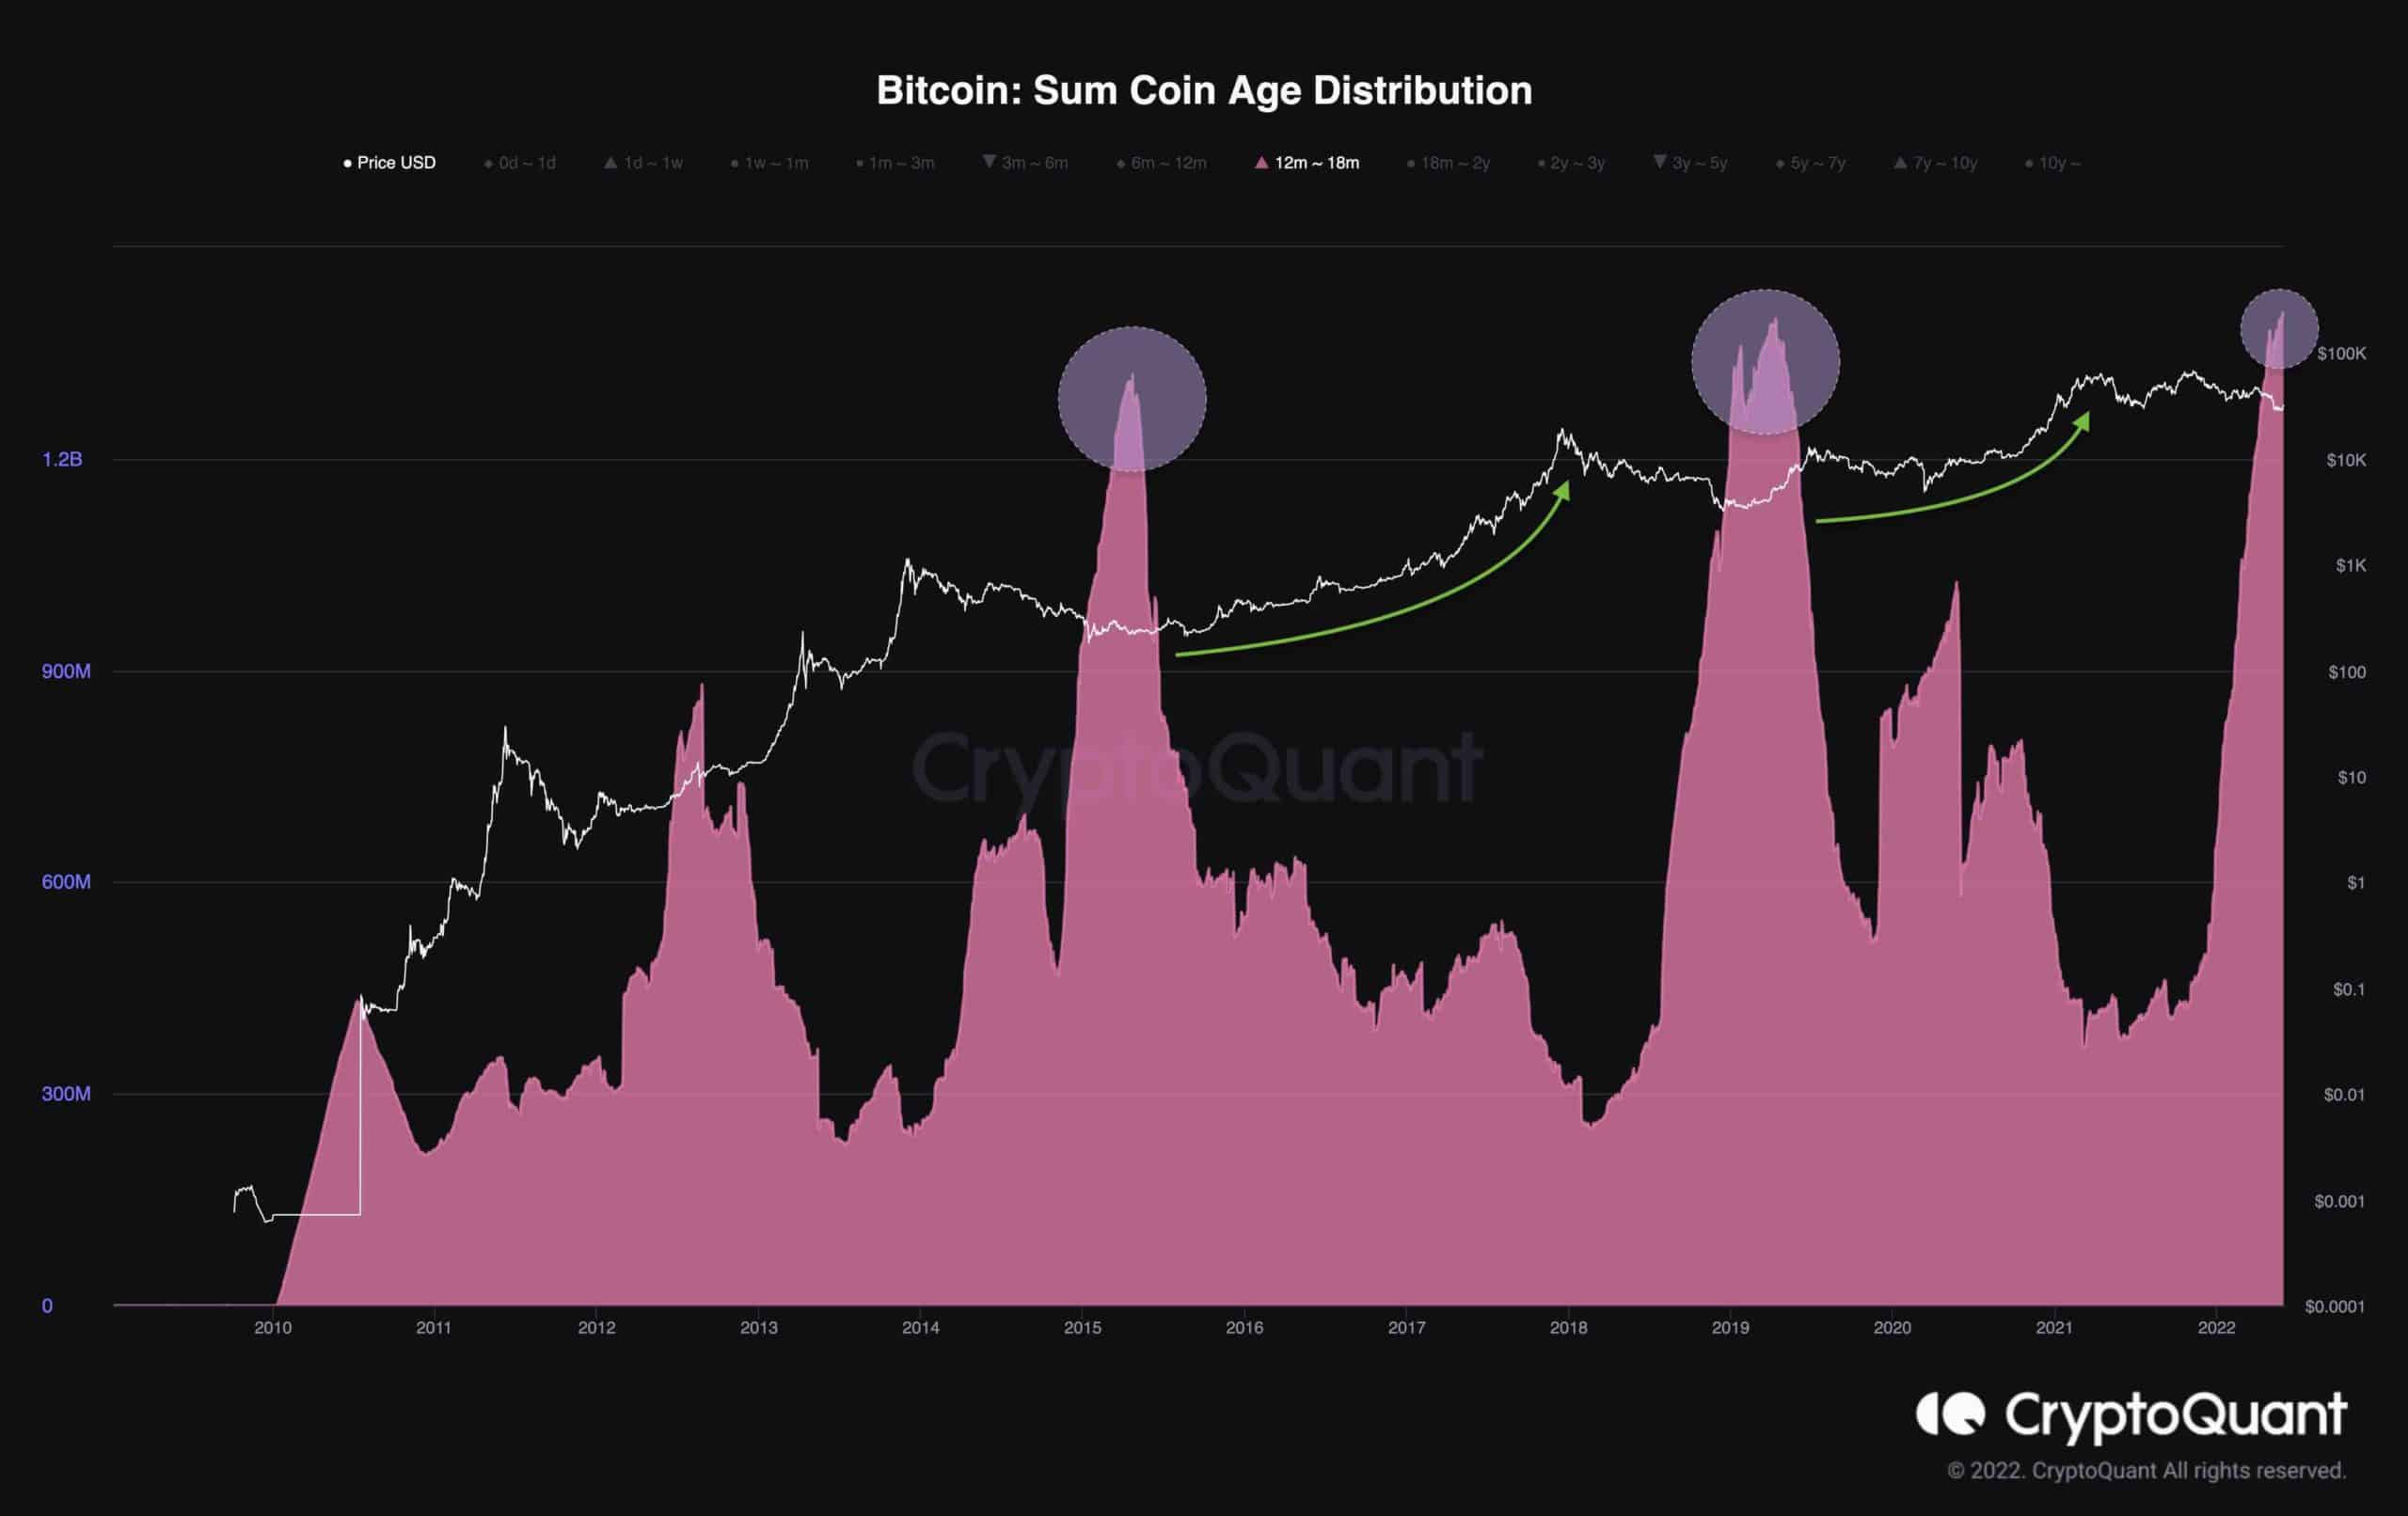
The Sum Coin Age Distribution (12month-18month old coins) from CryptoQuant is projected alongside the price of Bitcoin in this chart. With UTXO data, the Sum Coin Age Distribution (SCA Distribution) depicts the distribution of long-term Holders and short-term holders. If the long-term SCA Distribution ratio rises, it could mean that the coin’s future value will be higher than its current value, which is a bullish indication for the price.
The SCA metric has surged and reached levels that haven’t been achieved since 2015 and 2019 market bottoms. Each time the metric soared to this level, Bitcoin registered a bottom, initiating a new bullish rally.
Source: https://cryptopotato.com/bitcoin-price-analysis-btc-struggles-to-maintain-gains-is-30k-retest-inbound/