At the time of writing, Bitcoin is trading at $16,100. The following looks at the worst-case scenario in the short term, given the market’s broad pessimistic sentiment.
Техничка анализа
By Сивкаст
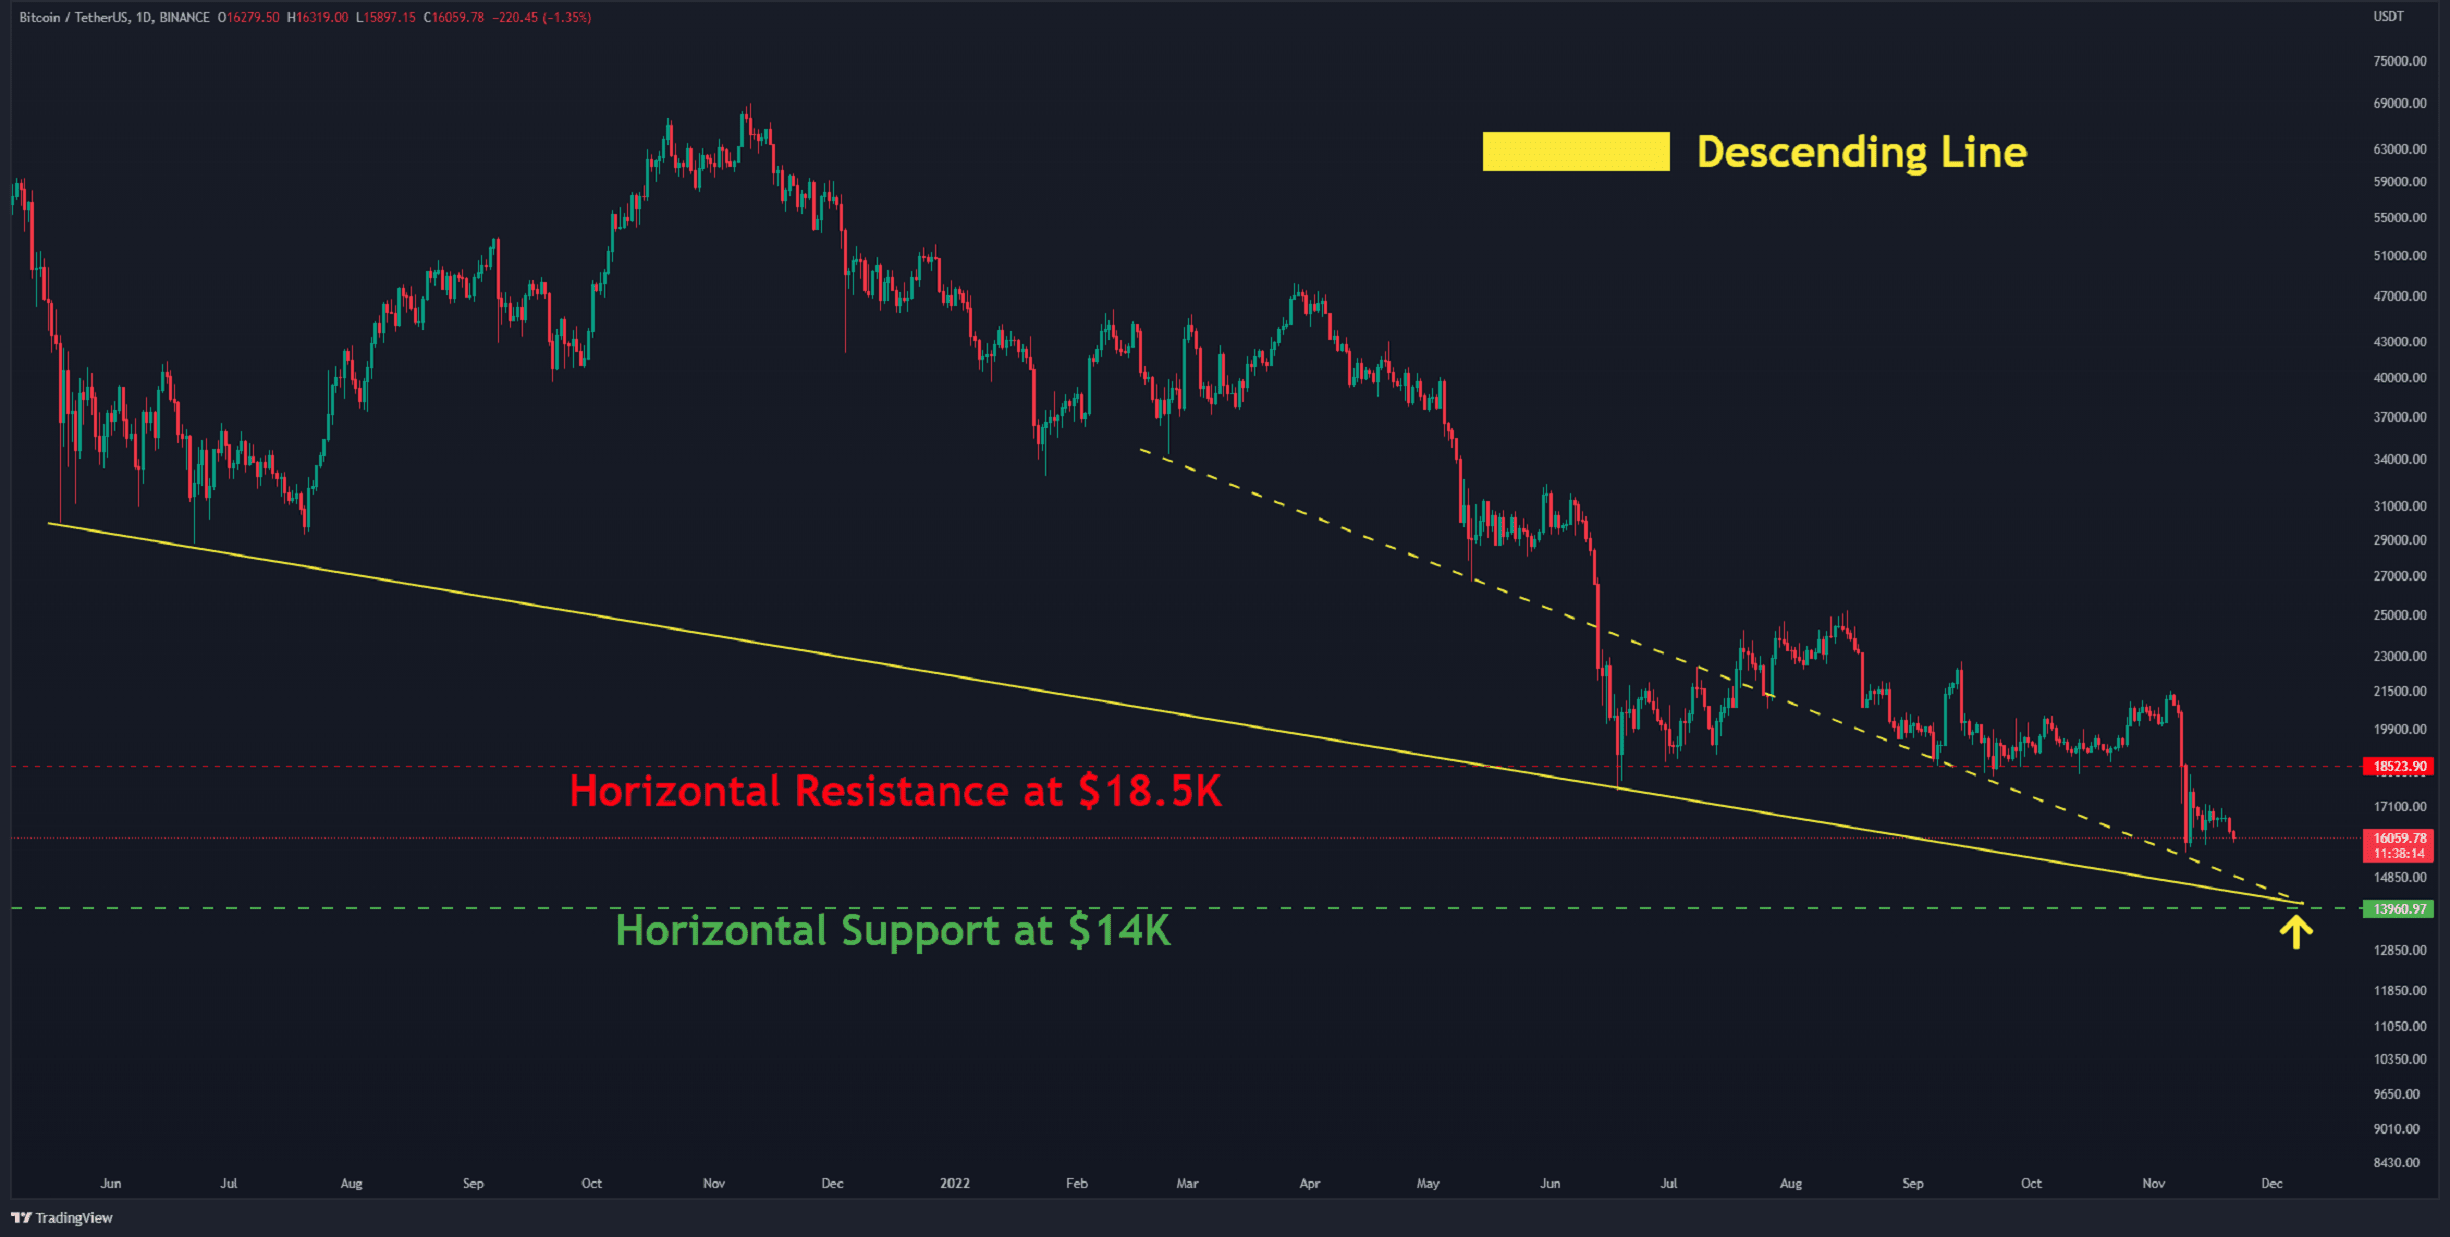
Дневни графикон:
On the daily chart, there are still no credible positive signs, and the cryptocurrency appears to be trending lower. Since the current market is shrouded in fear and uncertainty, a further decline is not out of the cards.
If Bitcoin continues to fall, the strongest support level is sitting at $14K, which is the intersection of the two descending lines (in yellow) and the horizontal support level (in green).

However, If the asset rises beyond $18.5K, the negative scenario would be invalidated. If that happens, Bitcoin could be set to begin a short-term rally.
Key Support Levels: $15.5K & $14K
Key Resistance Levels: $18.5K & $20.4K
Дневни покретни просеци:
МА20: 17963 долара
МА50: 19008 долара
МА100: 19707 долара
МА200: 22332 долара
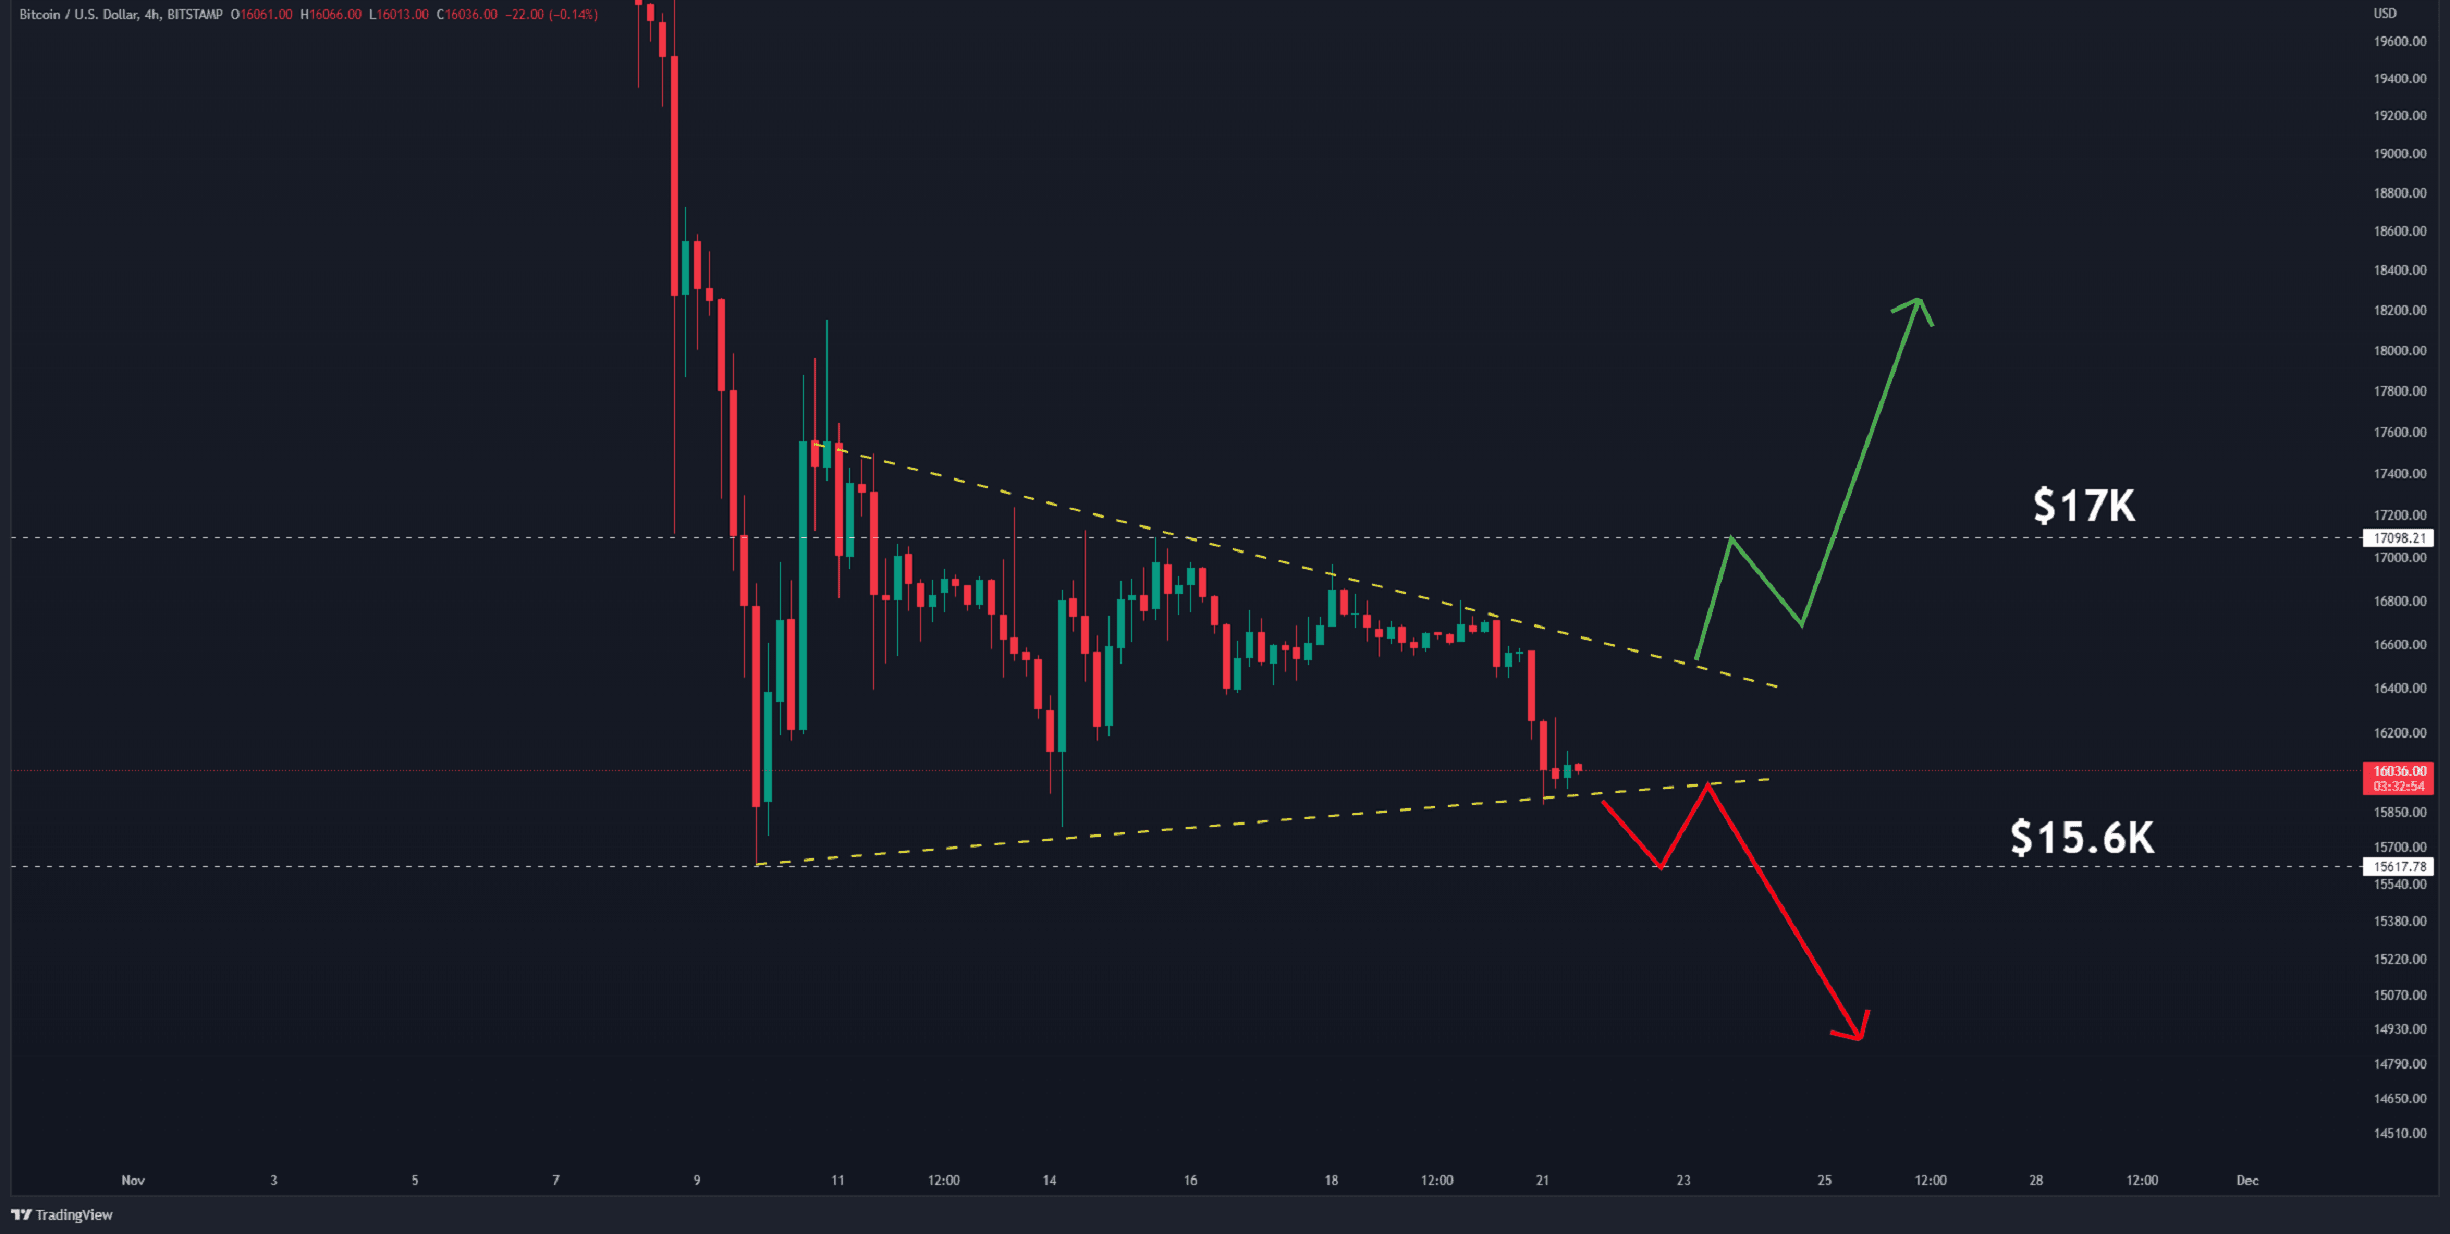
4-сатни графикон:
This week, the price has been fluctuating in a triangle (in yellow) on the lower timeframe. The two critical levels here are $17K and $15.6K. As demonstrated by the red and green hues, a break from any side followed by a small pullback can define the trend’s direction.
Technically, this pattern is frequently interpreted as a continuation. As a result, because the trend is downward, technical analysts anticipate the negative trend will continue. However, present volatility is driven more by the news. Therefore, it is preferable to pay close attention to the given horizontal levels.
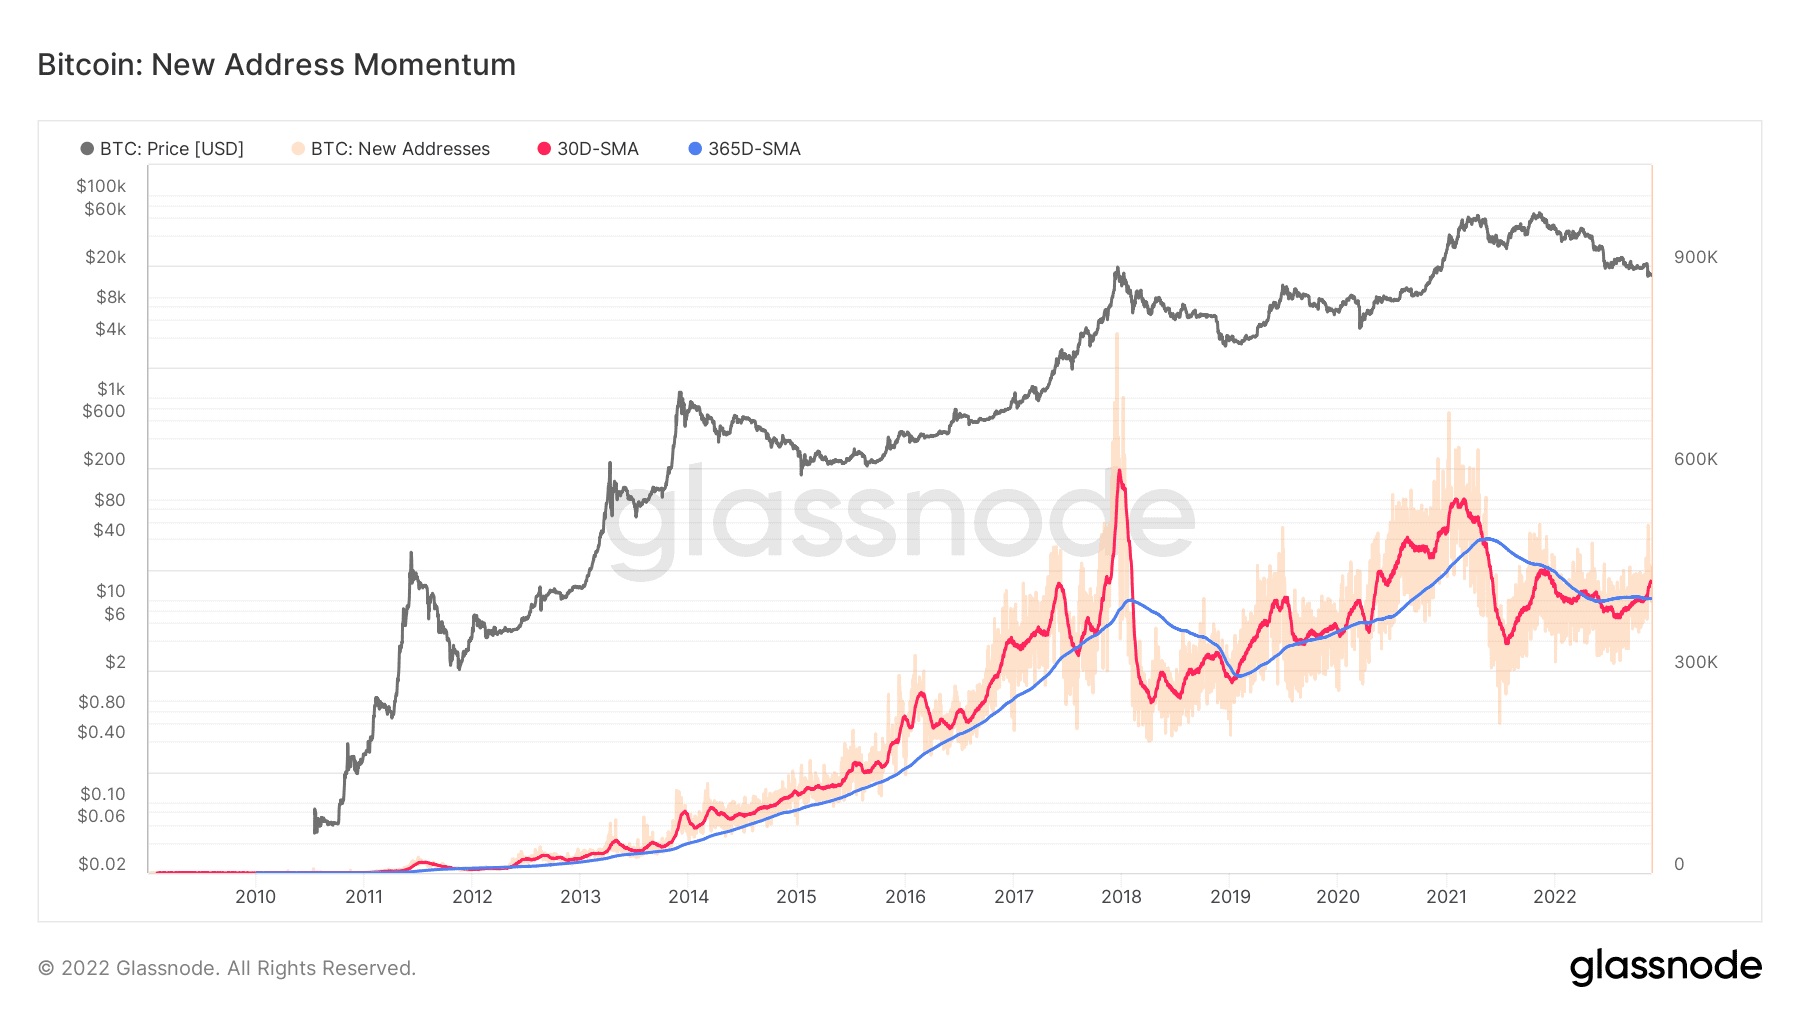
Анализа на ланцу
Healthy network adoption is often characterized by an uptick in daily active users, more transaction throughput, and increased demand for block space. This chart seeks to identify macro trend shifts in network adoption by comparing the Monthly Average 🔴 of New Addresses to the Yearly Average 🔵.
Currently, the monthly moving average 🔴 is slightly breaking above the yearly moving average 🔵 indicating an expansion in on-chain activity. However, typical improvement of network fundamentals and growing network utilization requires this momentum to keep rising for over 2 months.
Therefore, we should observe this metric before fully confirming the demand returning to the market.
Бинанце бесплатно $100 (ексклузивно): Користите ову везу да се региструјете и добијете 100 $ бесплатно и 10% попуста на Бинанце Футурес првог месеца (услови).
ПримеКСБТ специјална понуда: Користите ову везу да се региструјете и унесете ПОТАТО50 код да бисте добили до 7,000 долара на своје депозите.
Изјава о одрицању одговорности: Подаци који се налазе на ЦриптоПотато-у су подаци писаца. Не представља мишљење ЦриптоПотата о томе да ли куповати, продавати или задржати било каква улагања. Саветујемо вам да спроведете сопствено истраживање пре него што донесете било какве одлуке о инвестирању. Користите достављене информације на сопствени ризик. Погледајте одрицање за додатне информације.
Крипто валута од ТрадингВиев.
Source: https://cryptopotato.com/bitcoin-trading-at-historic-support-but-is-a-plunge-below-16k-inevitable-btc-price-analysis/