The selloff in cryptocurrencies continued to start the week, with bitcoin falling to its lowest level since July. Ethereum was also trading in the red, hitting multi-month lows in the process. This comes as the overall global market cap in cryptos was down close to 9% at the time of writing.
Bitcoin
Bitcoin (BTC), which has been the main focus of the recent decline in crypto prices, was trading 3% lower on Monday (at the time of writing), and almost 20% down from its position at the same time last week.
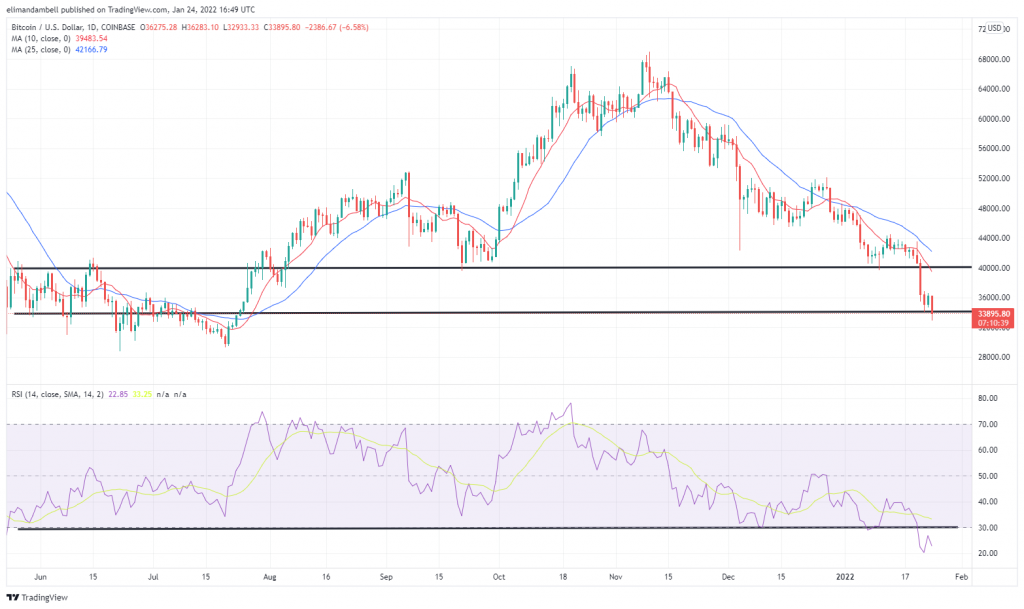
As of writing, BTC/USD hit an intraday low of $33,184.06 during today’s session, which is its lowest level since July 23rd last year. Today’s move comes as prices broke below the recent support level of $40,135 last Thursday and extended throughout the weekend.
Looking at the chart below, BTC appears to have found a new floor, reaching $34,200 on a daily chart. Although prices have moved beyond this interim support, some bulls argue that this could be a false breakout, pointing to the rally at the end of July as evidence for a potential reversal at this price range.
The RSI also shows that price strength is below 30 (currently tracking at 22), which typically signifies a market being oversold. However, with the real bullish momentum appearing to come in above 30, we may be in for some further consolidation today.

Ethereum
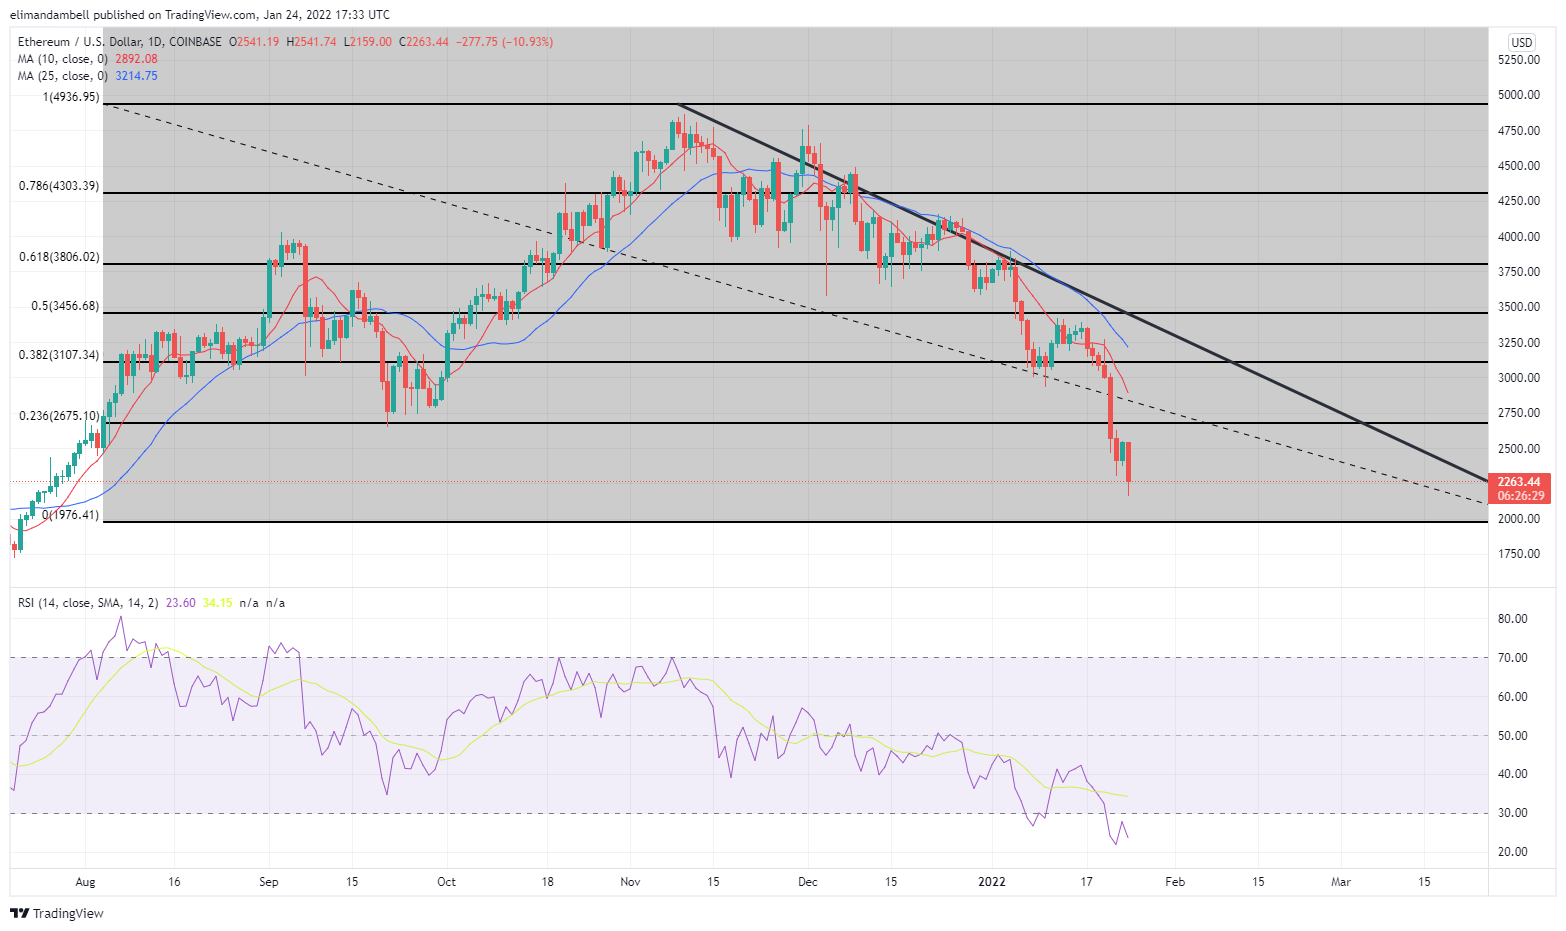
Ethereum (ETH) was down more than bitcoin to start the week, as the world’s second-largest cryptocurrency was trading over 8% lower during the session. ETH/USD fell to $2,172.30 on Monday, its lowest level since July 27th.
Similar to BTC, the chart below suggests that prices are oversold, however, the 10-day EMA also shows that there could be yet more bearish momentum, with a descending triangle highlighting a potential continuation of the current trend.

Ethereum bulls will likely be watching the 0.236% Fibonacci level as a potential target for the next significant rally in prices.
Уколико traders be careful of trying to catch what appears to be a falling knife? Let us know what you think about this subject in the comments section below.
Кредити за слике: Схуттерстоцк, Пикабаи, Вики Цоммонс, Традингвиев,
Одрицање од одговорности: Овај чланак служи само у информативне сврхе. То није директна понуда или прикупљање понуда за куповину или продају, или препорука или потврда било ког производа, услуге или компаније. Битцоин.цом не пружа савете о инвестирању, порезу, правним или рачуноводственим захтевима. Ни компанија ни аутор нису директно или индиректно одговорни за било какву штету или губитак проузрокован или наводно проузрокован или повезан са употребом или ослањањем на било који садржај, робу или услуге поменуте у овом чланку.
Source: https://news.bitcoin.com/bitcoin-ethereum-technical-analysis-btc-falls-to-5-month-low/
