Битцоин цена analysis is going down once again as the bears have returned to the price charts. The red candlestick is marking the loss in price, as it has moved down to the $20,900 level in the last past hours. The ongoing uptrend in price has been interrupted in this way as a downward price movement has been recorded. The reversal in trends proved to be quite discouraging for the buyers as an upturn in price was expected initially.
The support which was established at around $20,541 did not seem to hold up in the face of mounting bearish pressure. The BTC price is currently hovering above its psychological support level of $20,500. The latest downturn could push bitcoin back into an extended sideways trend as it continues to search for a bottom. It is becoming more and more apparent that the bearish market sentiment is continuing to persist. This could potentially open up the gates for a new low if BTC fails to find support at its current level.
The trading volume looks to have declined when compared to the previous days. This could be a sign that the buyers are reluctant to step in and initiate a new trend. Currently, the trading volume stands at around $29 billion, while the market cap has dropped to $404 billion.
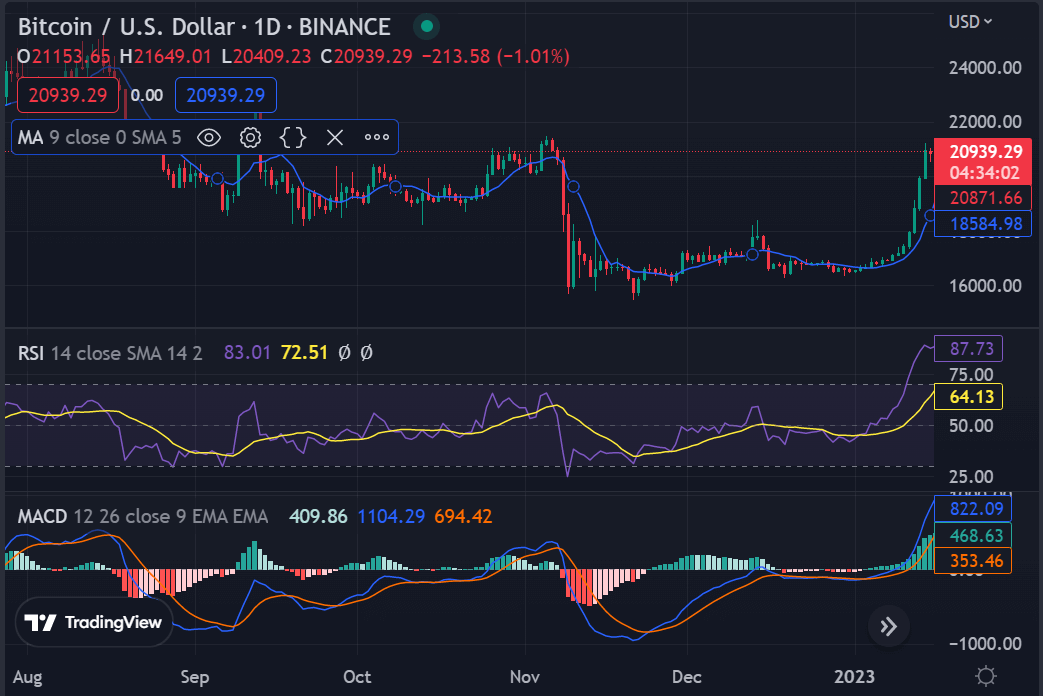
BTC/USD 1-day price chart: Bulls lose ground as bears succeed in bringing the downfall
The price is experiencing a fall once again as the one-day Bitcoin price analysis is indicating a bearish trend for the day. The price has decreased up to $20,900 in the last 24 hours, which is not so promising for the buyers. The price had been traveling quite steadily during the past few days but today, the trends have shifted as now the bears are at the lead. The bulls were in control of the market later today, but it all changed when the bearish pressure started to take over.

The moving average (MA) value is still at a lower level as compared to the price i.e. $20,939. This is another indication that bearish sentiments are still prevailing in the market. The Relative Strength Index (RSI) also confirms this fact as it has come down to 64.13 points. The MACD has also shifted to the bearish side and is not looking good for a price recovery.
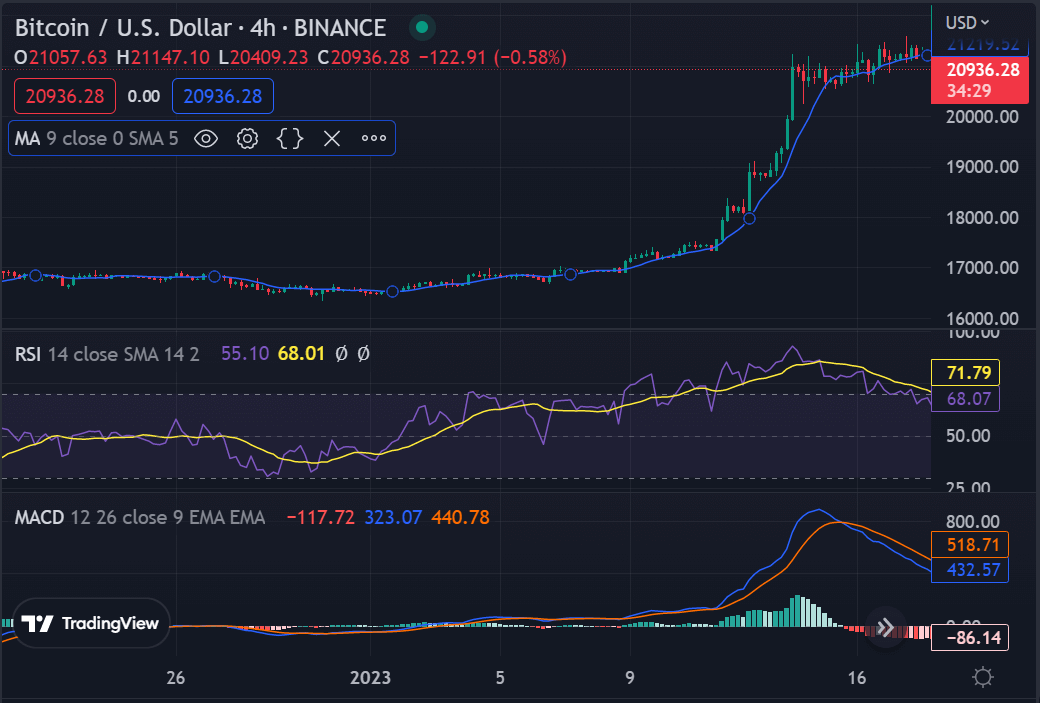
Bitcoin price analysis 4-hour price chart: Bearish trend remains intact
The 4-hour Bitcoin price analysis is painting a similar picture as the one-day chart. The bearish sentiment has kept its grip on the market and BTC/USD retraced to $20,900. The downward movement was facilitated by both the moving averages which have shifted towards the lower level when compared to the current price. The 20-period and the 50-period MA are both below the current price level, which is a sign of further bearish pressure ahead.

The RSI has also fallen further to 71.79 points as it was unable to sustain its position above 80 points. This means that the bearish sentiment is still prevailing in the market despite the slight recovery in the prices. The MACD, on the other hand, is still looking to break out of a bearish zone as it has shifted back slightly toward the positive side.
Закључак анализе цена биткоина
To sum up the Bitcoin price analysis for today, it is clear that the bearish pressure has gained control of the market. The price has dipped down to the $20,900 level as it was unable to sustain its position above the $21,000 point. Both the moving averages and technical indicators support this bearish sentiment and suggest that a further decline in prices is likely. The buyers will need to take back control of the market if they want to see a recovery in the prices. Until then, BTC will remain in the grips of the bears.
Извор: хттпс://ввв.цриптополитан.цом/битцоин-прице-аналисис-2023-01-18/
