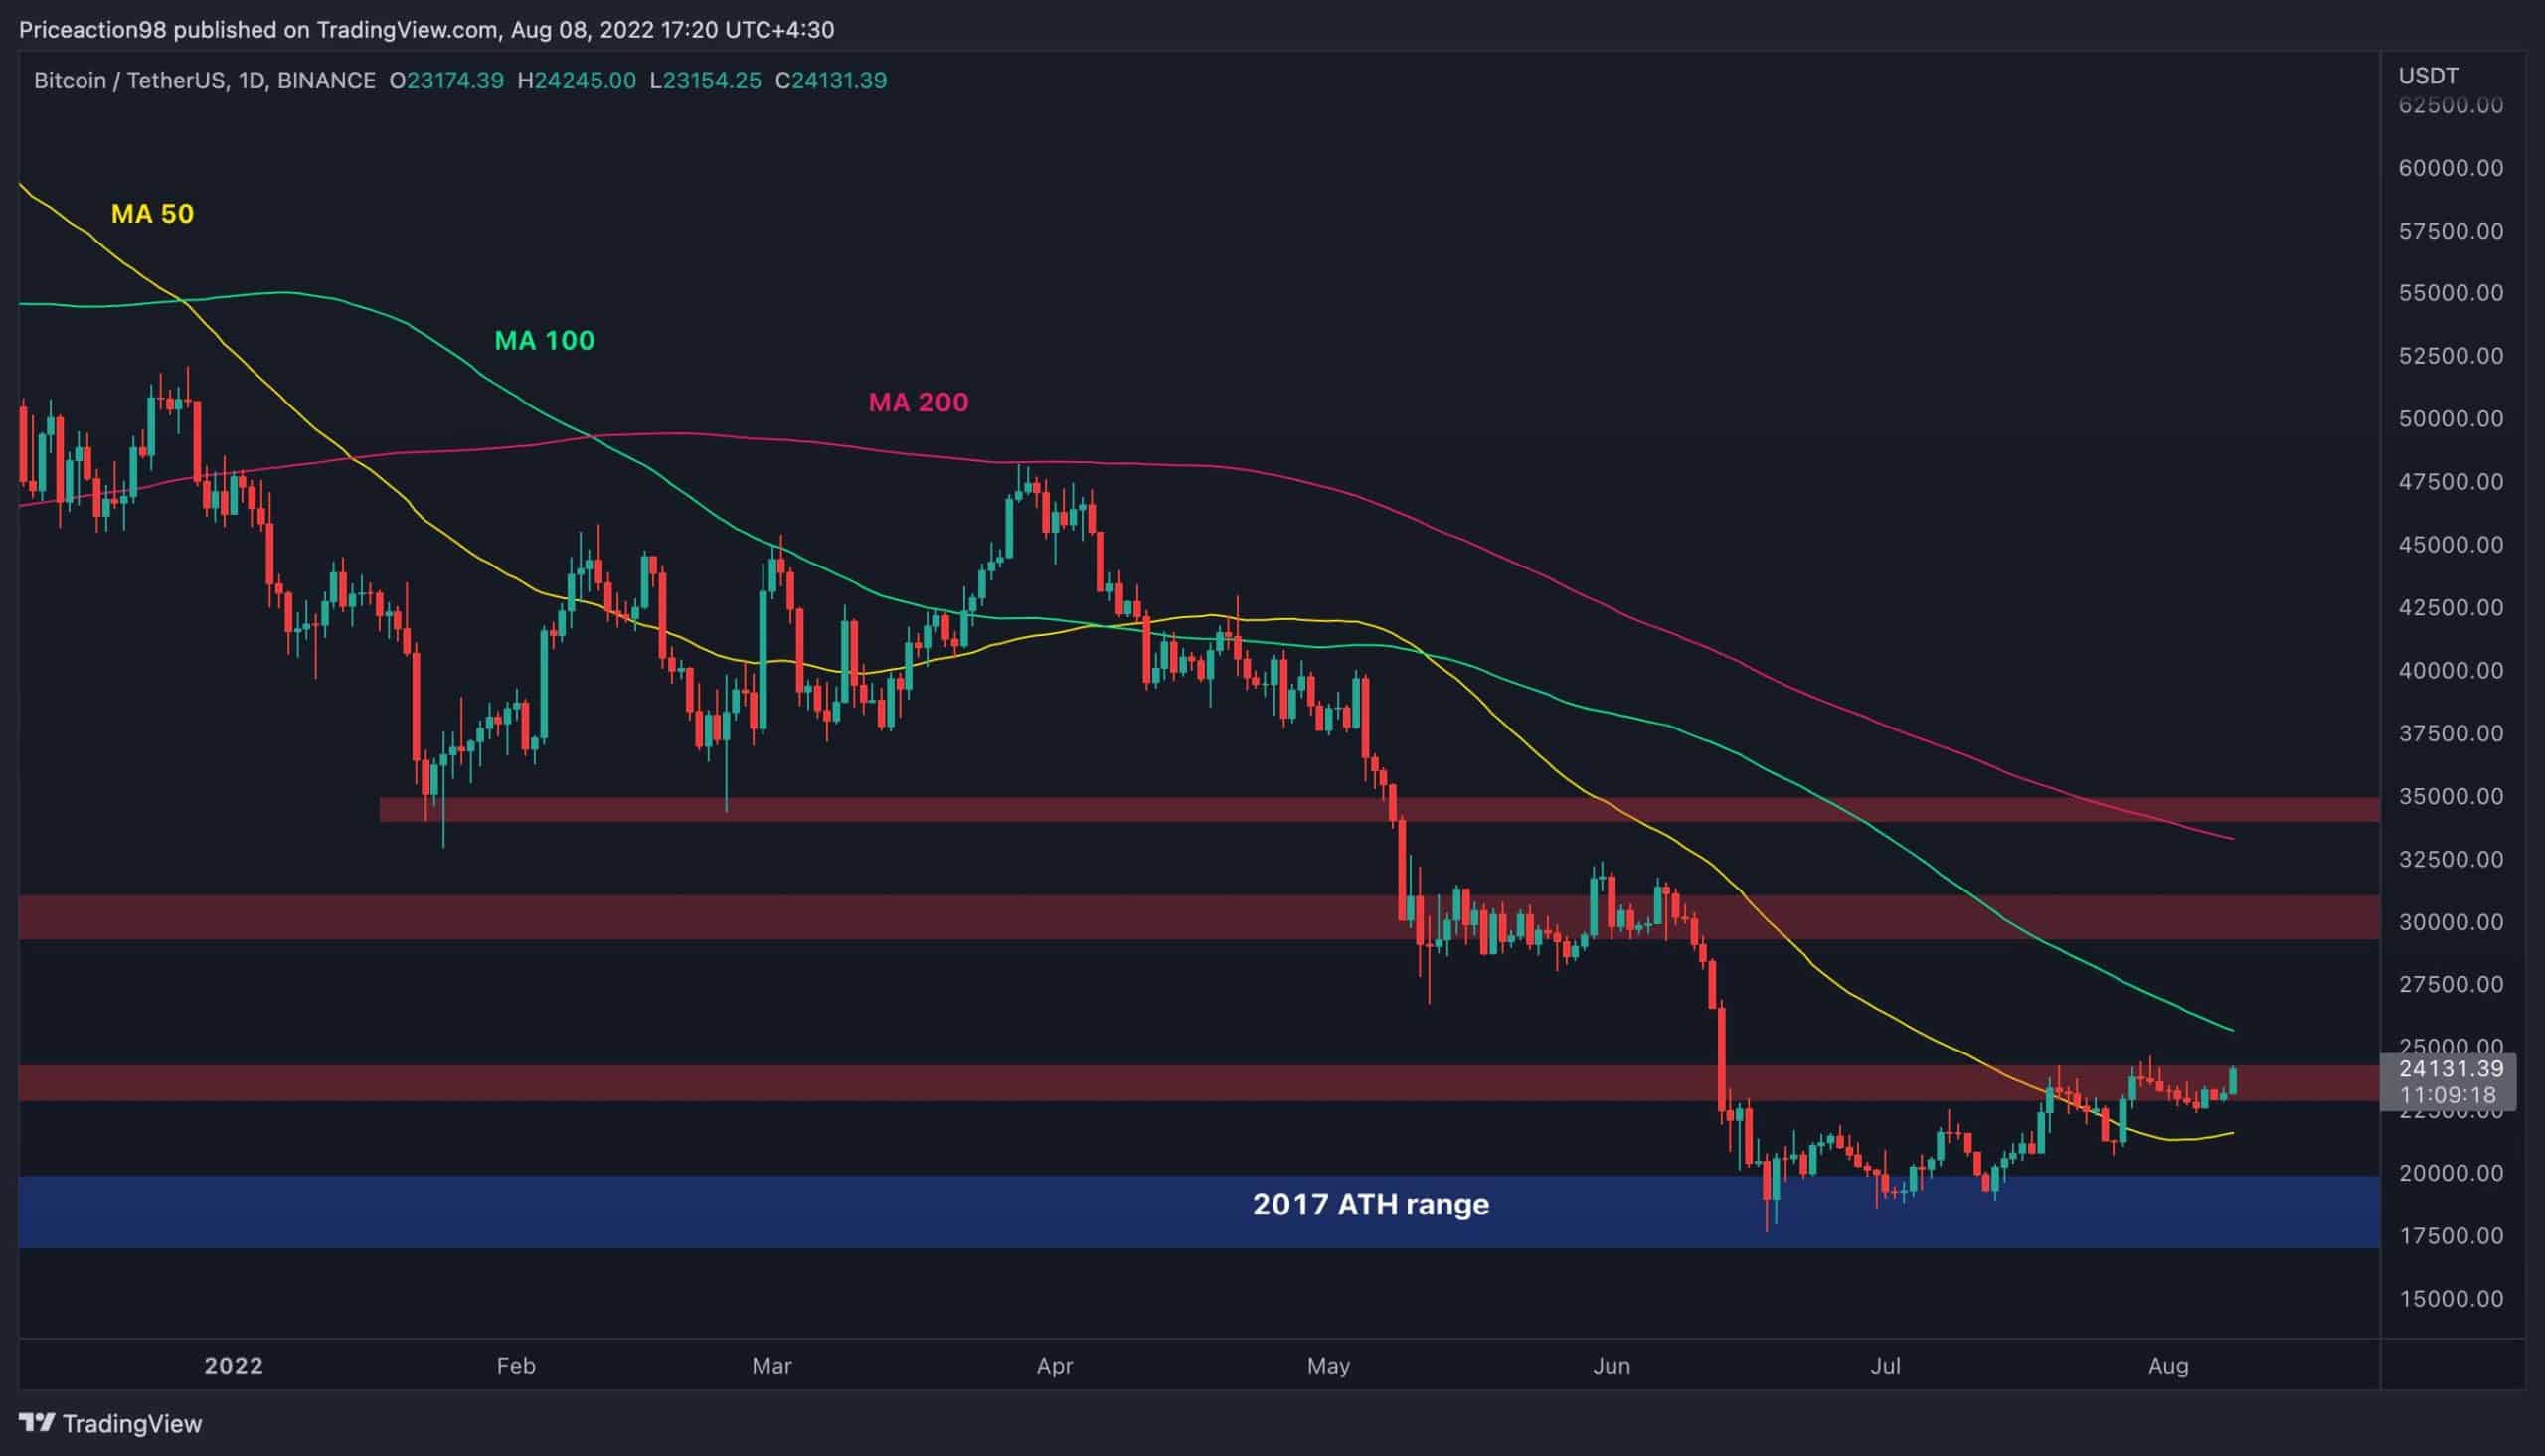
Bitcoin’s price finally seems to be breaking the $24K resistance level after a period of rejections. The cryptocurrency has rebounded from the $17K-$20K range. It surpassed the 50-day moving average but has so far been unable to breach the $24K level to the upside.
Техничка анализа
Би: Едрис
Дневни графикон
It seems like the significant resistance level of $24K may be breached. The 100-day moving average sitting at the $26K mark would then be the next obstacle. If the price can continue above it, the $30K supply zone would be the short-term target.
On the flip side, if the price fails to break the moving average and drops below the $24K mark, another bearish continuation could begin. This could result in a potential crash below the $20K support.
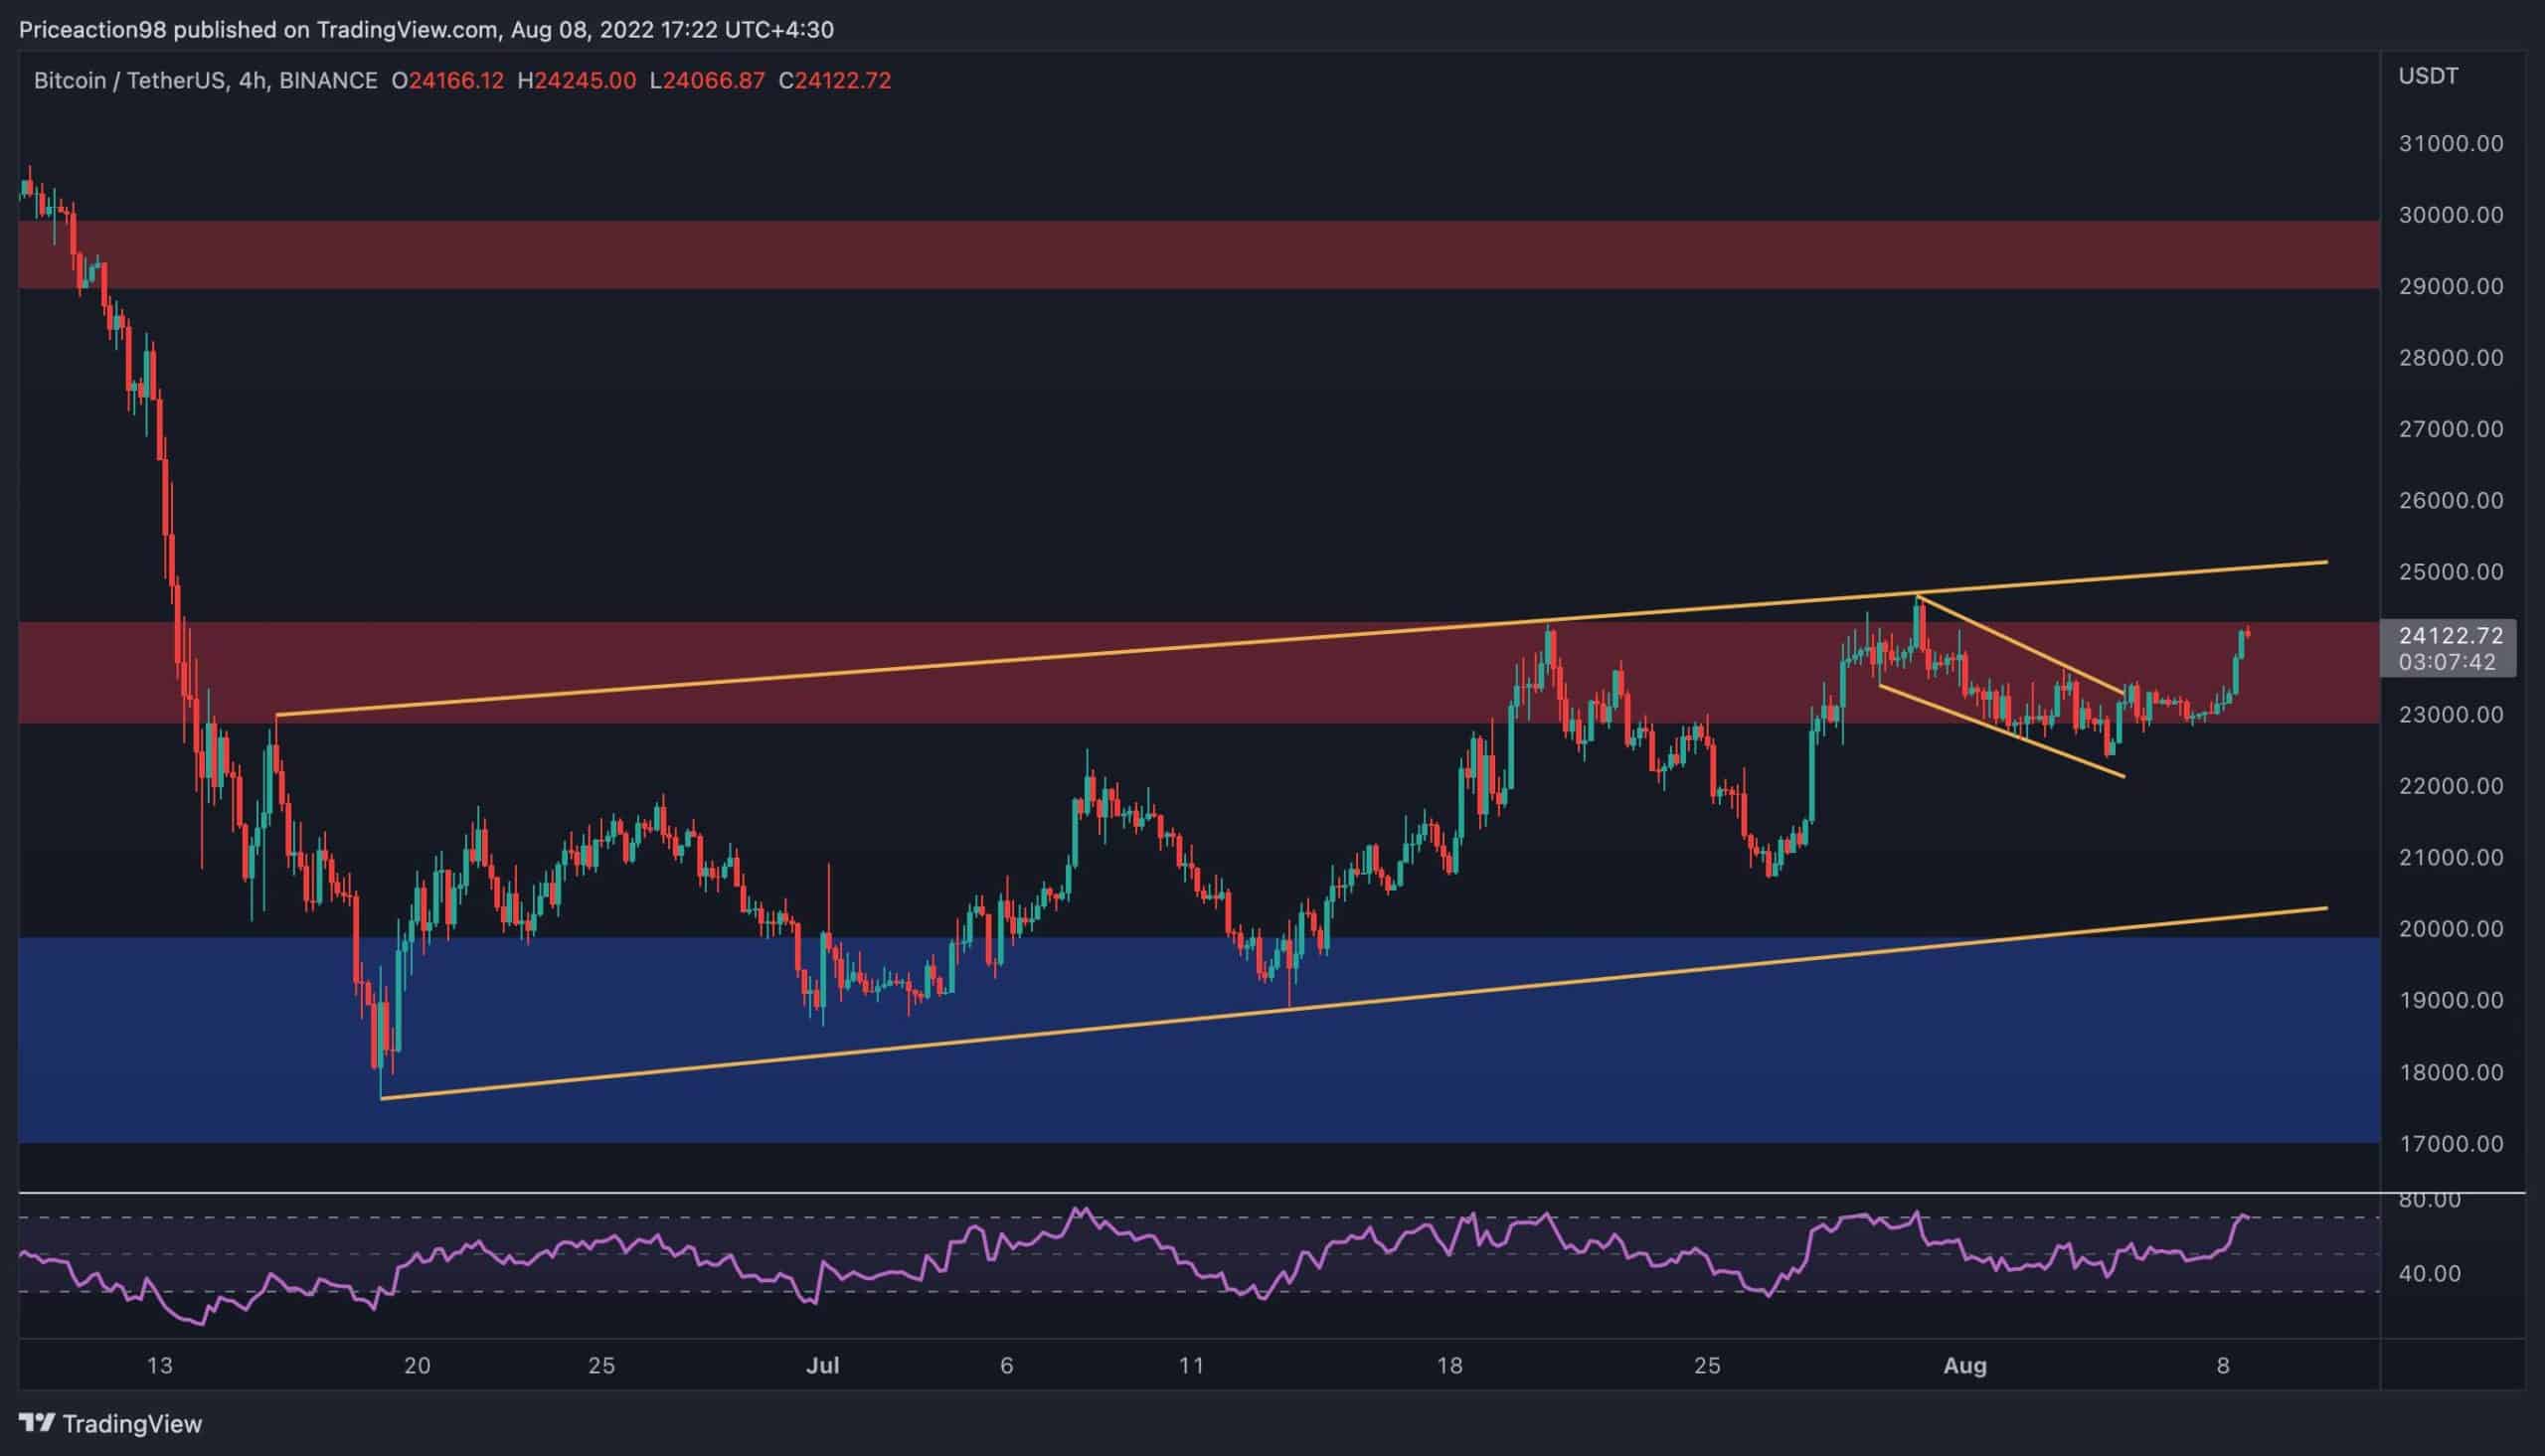
4-сатни графикон
On the 4-hour timeframe, the price managed to break the small bullish flag and rallied towards the $24K mark. However, the larger bearish flag is yet to be broken, as the bulls begin their fourth attempt at the higher boundary of the pattern. A valid breakout above the flag would likely lead to a rally towards the $30K supply zone.
At the same time, the RSI indicator is currently signaling an overbought state. This could result in either a short-term pullback or an overall bearish reversal. If the latter is true, a bearish breakout from the flag and continuation below $20K, and even $15K, would be probable. The lower timeframe price action should be monitored carefully this week to determine which scenario is more likely, and act accordingly.
Анализа на ланцу
Би: Едрис
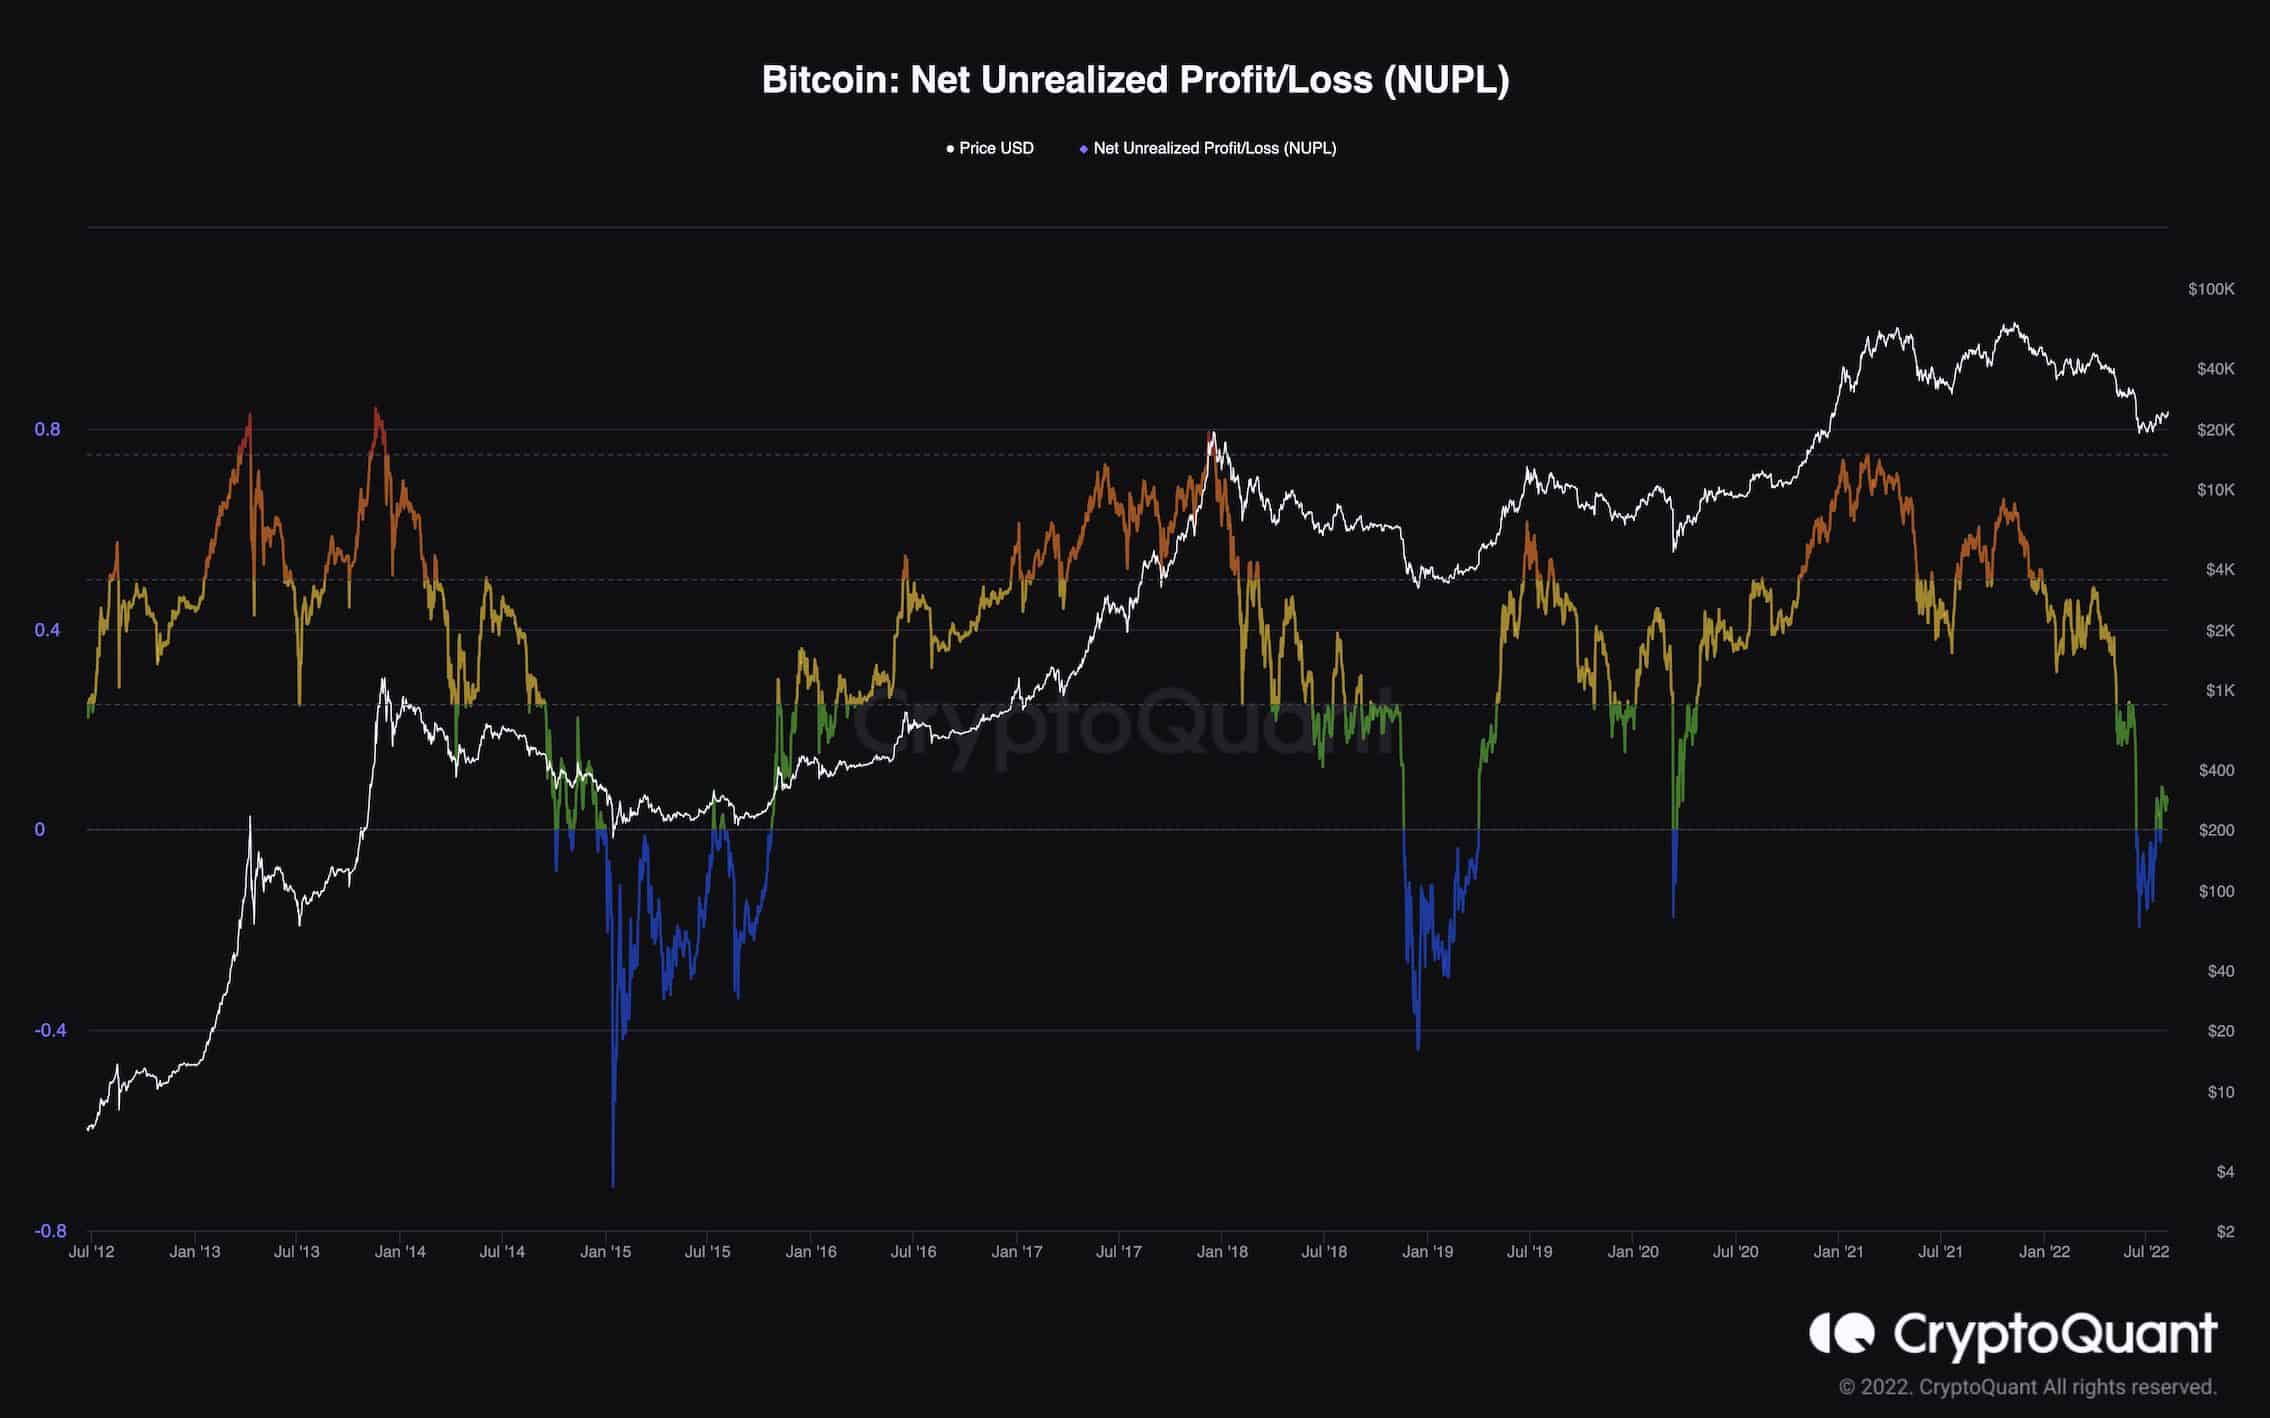
Битцоин нето нереализовани добитак/губитак
Bitcoin’s strong downtrend over the last few months has put immense pressure on all market participants. Many investors have sold their coins at massive losses and exited the market, fearing more downturn.
And yet, according to Net Unrealized Profit/Losses metric, the market might be nearing the bottom. This metric measures the ratio of unrealized profits/losses. It is a useful indicator to evaluate market sentiment. The market has felt bleak in recent months, as the NUPL metric was demonstrating values below 0 – a region that has identified previous bottoms.
During the recent increase in price, the NUPL has moved back above 0. This has previously signaled the end of bear markets and the beginning of a new uptrend. It’s important to note that other metrics and the overall macroeconomic picture must also be monitored in the short term to determine whether a new bull market or another bull trap is the case.
Бинанце бесплатно $100 (ексклузивно): Користите ову везу да се региструјете и добијете 100 $ бесплатно и 10% попуста на Бинанце Футурес првог месеца (услови).
ПримеКСБТ специјална понуда: Користите ову везу да се региструјете и унесете ПОТАТО50 код да бисте добили до 7,000 долара на своје депозите.
Изјава о одрицању одговорности: Подаци који се налазе на ЦриптоПотато-у су подаци писаца. Не представља мишљење ЦриптоПотата о томе да ли куповати, продавати или задржати било каква улагања. Саветујемо вам да спроведете сопствено истраживање пре него што донесете било какве одлуке о инвестирању. Користите достављене информације на сопствени ризик. Погледајте одрицање за додатне информације.
Крипто валута од ТрадингВиев.
Source: https://cryptopotato.com/heres-the-next-target-for-bitcoin-if-24k-falls-btc-price-analysis/