ТЛ; ДР
- U.S. CPI sparks upward revision to the expected fed-funds rate
- U.K. stays top of the G7 inflation league, with actual CPI year-over-year of 9.9%
- GBP saw new lows against the U.S dollar, same levels as 1985
- There’s a 30% probability of a 100bps rate hike in the next FOMC meeting
- Етхереум'с highly anticipated merge took place on Sept. 15 and was successful
- Goldman Sachs prepares for layoffs as deal-making slows
- ФедЕк CEO says he expects the economy to enter a ‘worldwide recession’ due to a big miss in earnings
- Bitcoin’s hash rate hits an all-time high
- Bitcoin difficulty adjustment hits all-time high
Преглед макроа
CPI sparked a revision upwards to the expected fed-funds rate
Another upside U.S. inflation report sank hopes of the pace of policy tightening, which sent fixed-income yields and the dollar soaring. U.S. equities plunged in the worst one-day loss since mid-2020, with the expectation now on the fed to hike 75 bps next week. Core and headline inflation exceeded forecasts which caused investors to abandon previous assumptions of a 50 bps hike.
Consumer Price Index (CPI) is the index of the variation in prices for retail goods and other items. Headline CPI came in топлије од очекиваног, as traders were convinced we were at ‘peak inflation,’ which sent markets into turmoil. Nasdaq closed 5.5% lower, Bitcoin fell below $20,000, and gold traded 1% below the previous close.
The two-year treasury rate is the yield received for investing in a U.S. government-issued security with a maturity of two years. The two-year yield is included in the shorter yield curve, which is an important indicator when observing the U.S economy. A big sell-off occurred in treasuries weighted to the front end that saw the two-year treasury reach its highest point since November 2007.
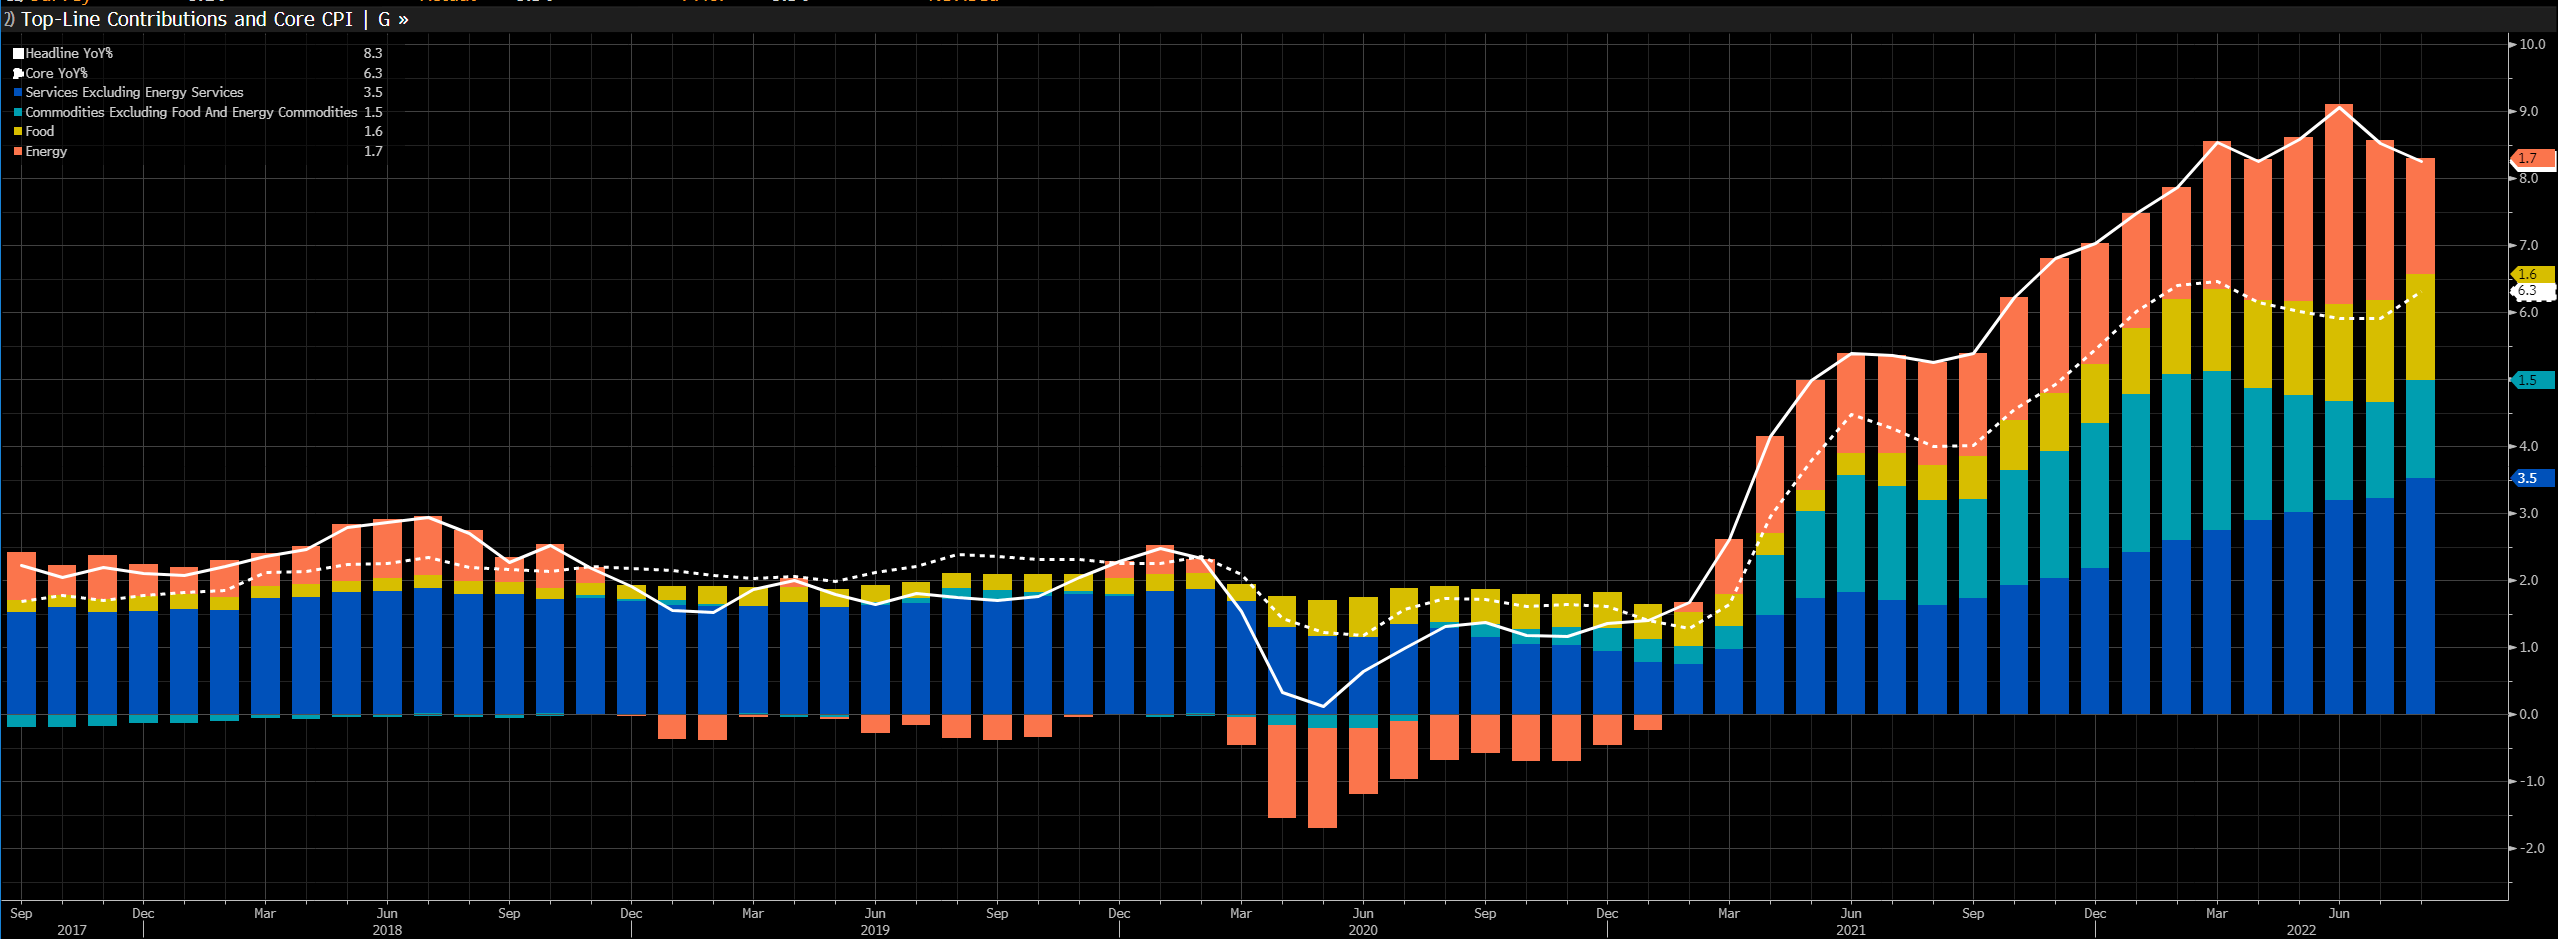
Headline inflation slowed from 8.5% to 8.3% thanks to a 10.6% monthly decline in gasoline, while other indexes also fell, including airline fairs and used cars. However, this was offset by a rise in food, shelter, and medical services.
The inflation wasn’t just supply chain issues but also the fiscal and monetary components. Flooding the system with broad money resets aggregate prices higher permanently, making the fed’s job to tame inflation that much harder.
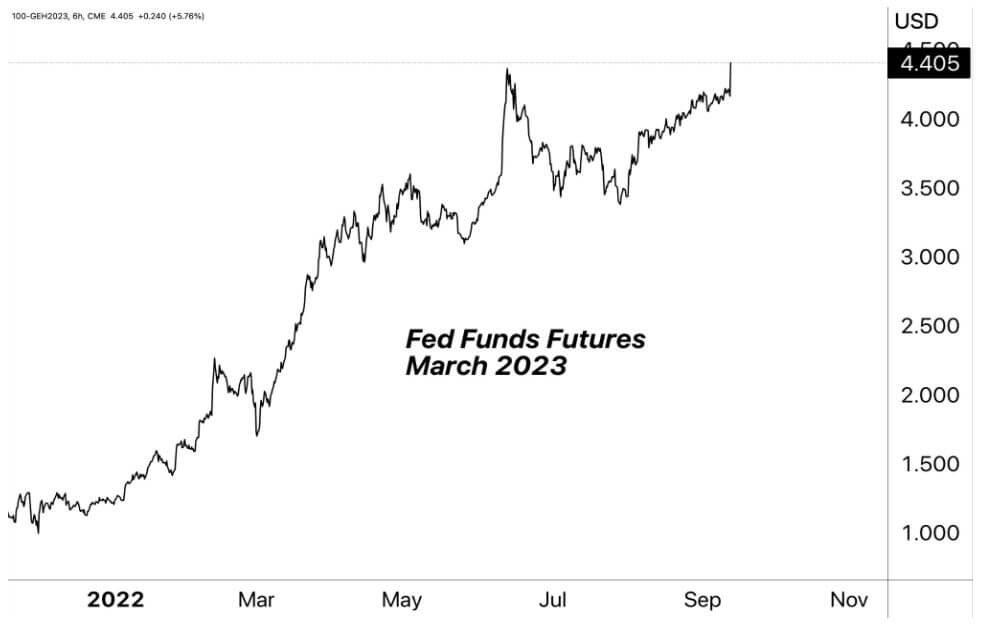
Fed funds futures exceed 4%
Inflation has been climbing for over two years, to be exact, 27 months of rising inflation. The food index had increased 11.4% YOY. However, most notably, the energy cost was up almost 25% YOY, the most significant 12-month increase since May 1979.
Due to a hotter-than-expected CPI print, the fed funds futures (derivatives based on the federal funds rate, the U.S. overnight interbank lending rate on reserves deposited with the Fed). Is now pricing in a 70 % chance of a 75 bps rate hike and a 30 % chance of a 100 bps hike for Sept. 21. Furthermore, the fed funds rate is projecting a terminal velocity of 4.5% to be reached by the first quarter of 2023 after the U.S. CPI data was released. Risk assets will continue to suffer as rates rise and liquidity dries from quantitative tightening (QT).
Корелације
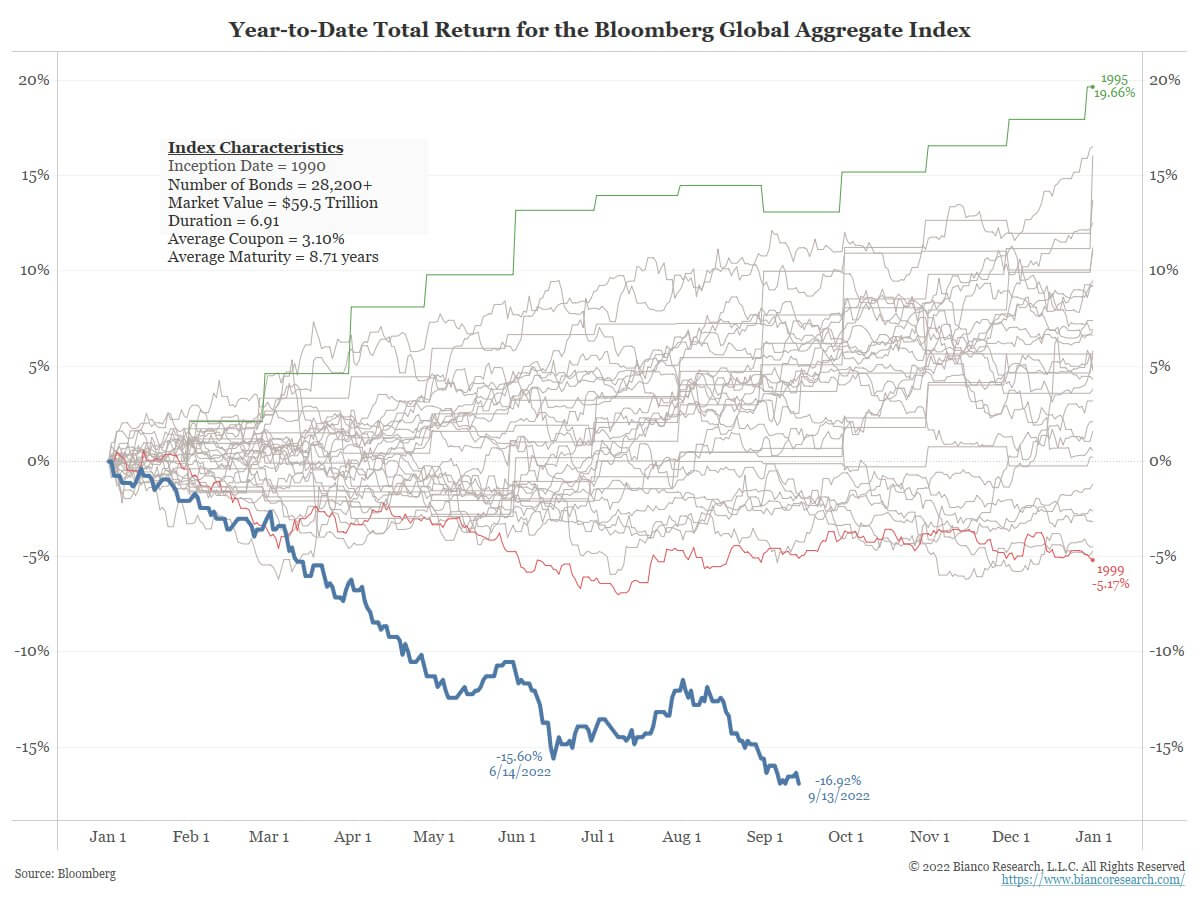
The year of the bear
The bears have been dominant for the majority of 2022. Sept. 13, Dow Jones plummeted more than 1,250 points and is trading lower than it was after Biden’s first full day in office (January 2021). The bond market has seen absolute carnage; the total return for the Bloomberg Global Aggregate Index set a new low on Sept. 13, down 16.93%, since its inception date back in 1990.
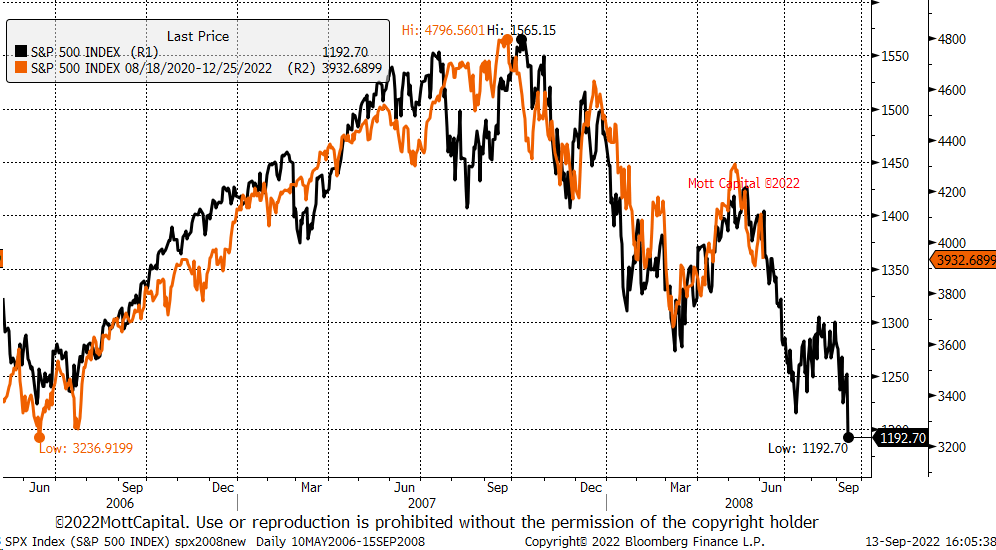
Wall Street has had its worst day since June 2020, as the S&P is flirting with bear market territory. The correlation chart shows the 2008 S&P performance (black) against the 2022 S&P performance (orange). A tight and symmetrical correlation with one another, and the worst is yet to come, according to the data.
Мерач акција и волатилности
Стандард анд Поор'с 500, или једноставно С&П 500, је берзански индекс који прати перформансе акција 500 великих компанија које котирају на берзама у Сједињеним Државама. С&П КСНУМКС 3,873 -4.2% (5Д)
Насдак берза је америчка берза са седиштем у Њујорку. По тржишној капитализацији акција којима се тргује заузима друго место на листи берзи, иза Њујоршке берзе. НАСДАК 11,855 -4.3% (5Д)
Цбое индекс волатилности, или ВИКС, је тржишни индекс у реалном времену који представља очекивања тржишта у погледу волатилности у наредних 30 дана. Инвеститори користе ВИКС за мерење нивоа ризика, страха или стреса на тржишту када доносе одлуке о улагању. ВИКС 26 100% (5Д)
Стонкс
Year-to-date, Nasdaq is down 26%, S&P 500 is down 18%, and Dow is down 14%. Sept. 13, the Nasdaq had its biggest crash since march 2020 and could expect to see this trend continue until the end of the year as the fed continues to hike rates.
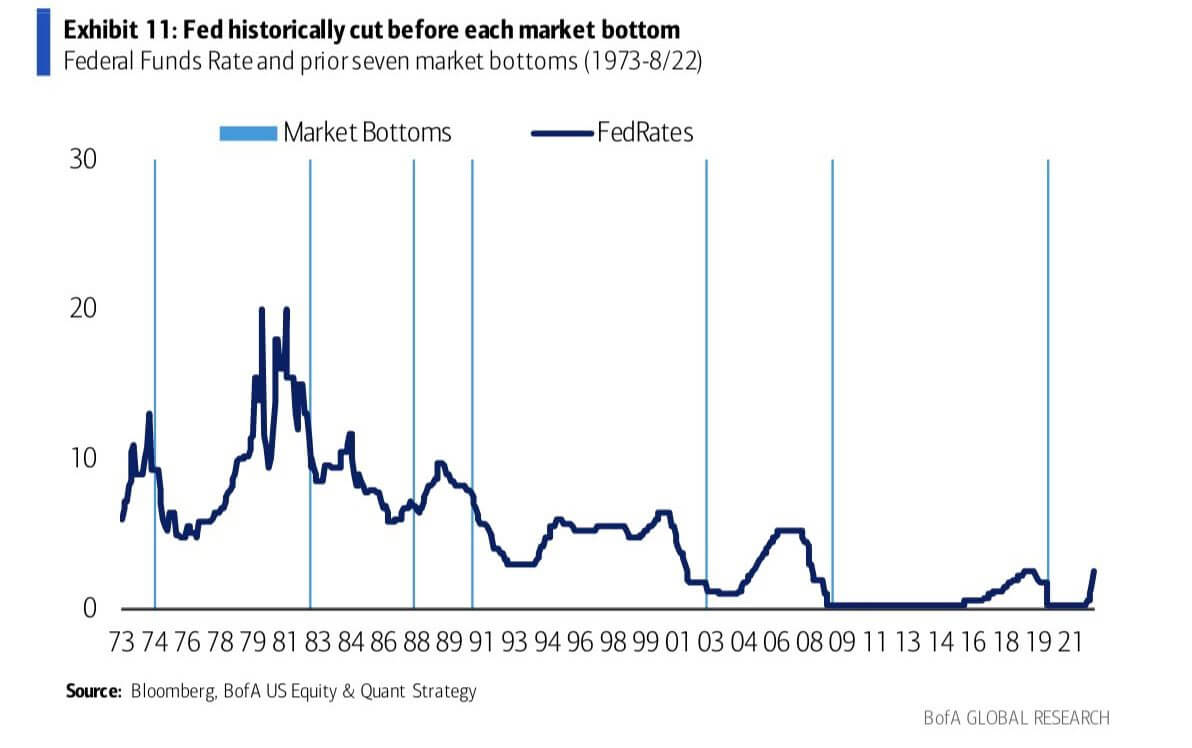
Historically in traditional markets, -20% is considered bear market territory. Bottoms in market cycles usually finish around the same time the fed funds rate starts cutting or pausing in their hiking cycle. As the fed continues on the path of destruction, it would be naïve to think the bottom is in for equities.
Роба
Потражња за златом одређена је количином злата у резервама централне банке, вредношћу америчког долара и жељом да се злато задржи као заштита од инфлације и девалвације валуте, све то помаже у подизању цене племенитог метала. Цена злата $1,676 -2.46% (5Д)
Слично већини роба, цену сребра одређују шпекулације и понуда и потражња. На то такође утичу услови на тржишту (велики трговци или инвеститори и кратка продаја), индустријска, комерцијална и потрошачка потражња, заштита од финансијског стреса и цене злата. Цена сребра $20 100% (5Д)
Цена нафте, или цена нафте, генерално се односи на спот цену барела (159 литара) референтне сирове нафте. Цена сирове нафте $85 100% (5Д)
SPR continues to get drained ahead of the mid-term elections
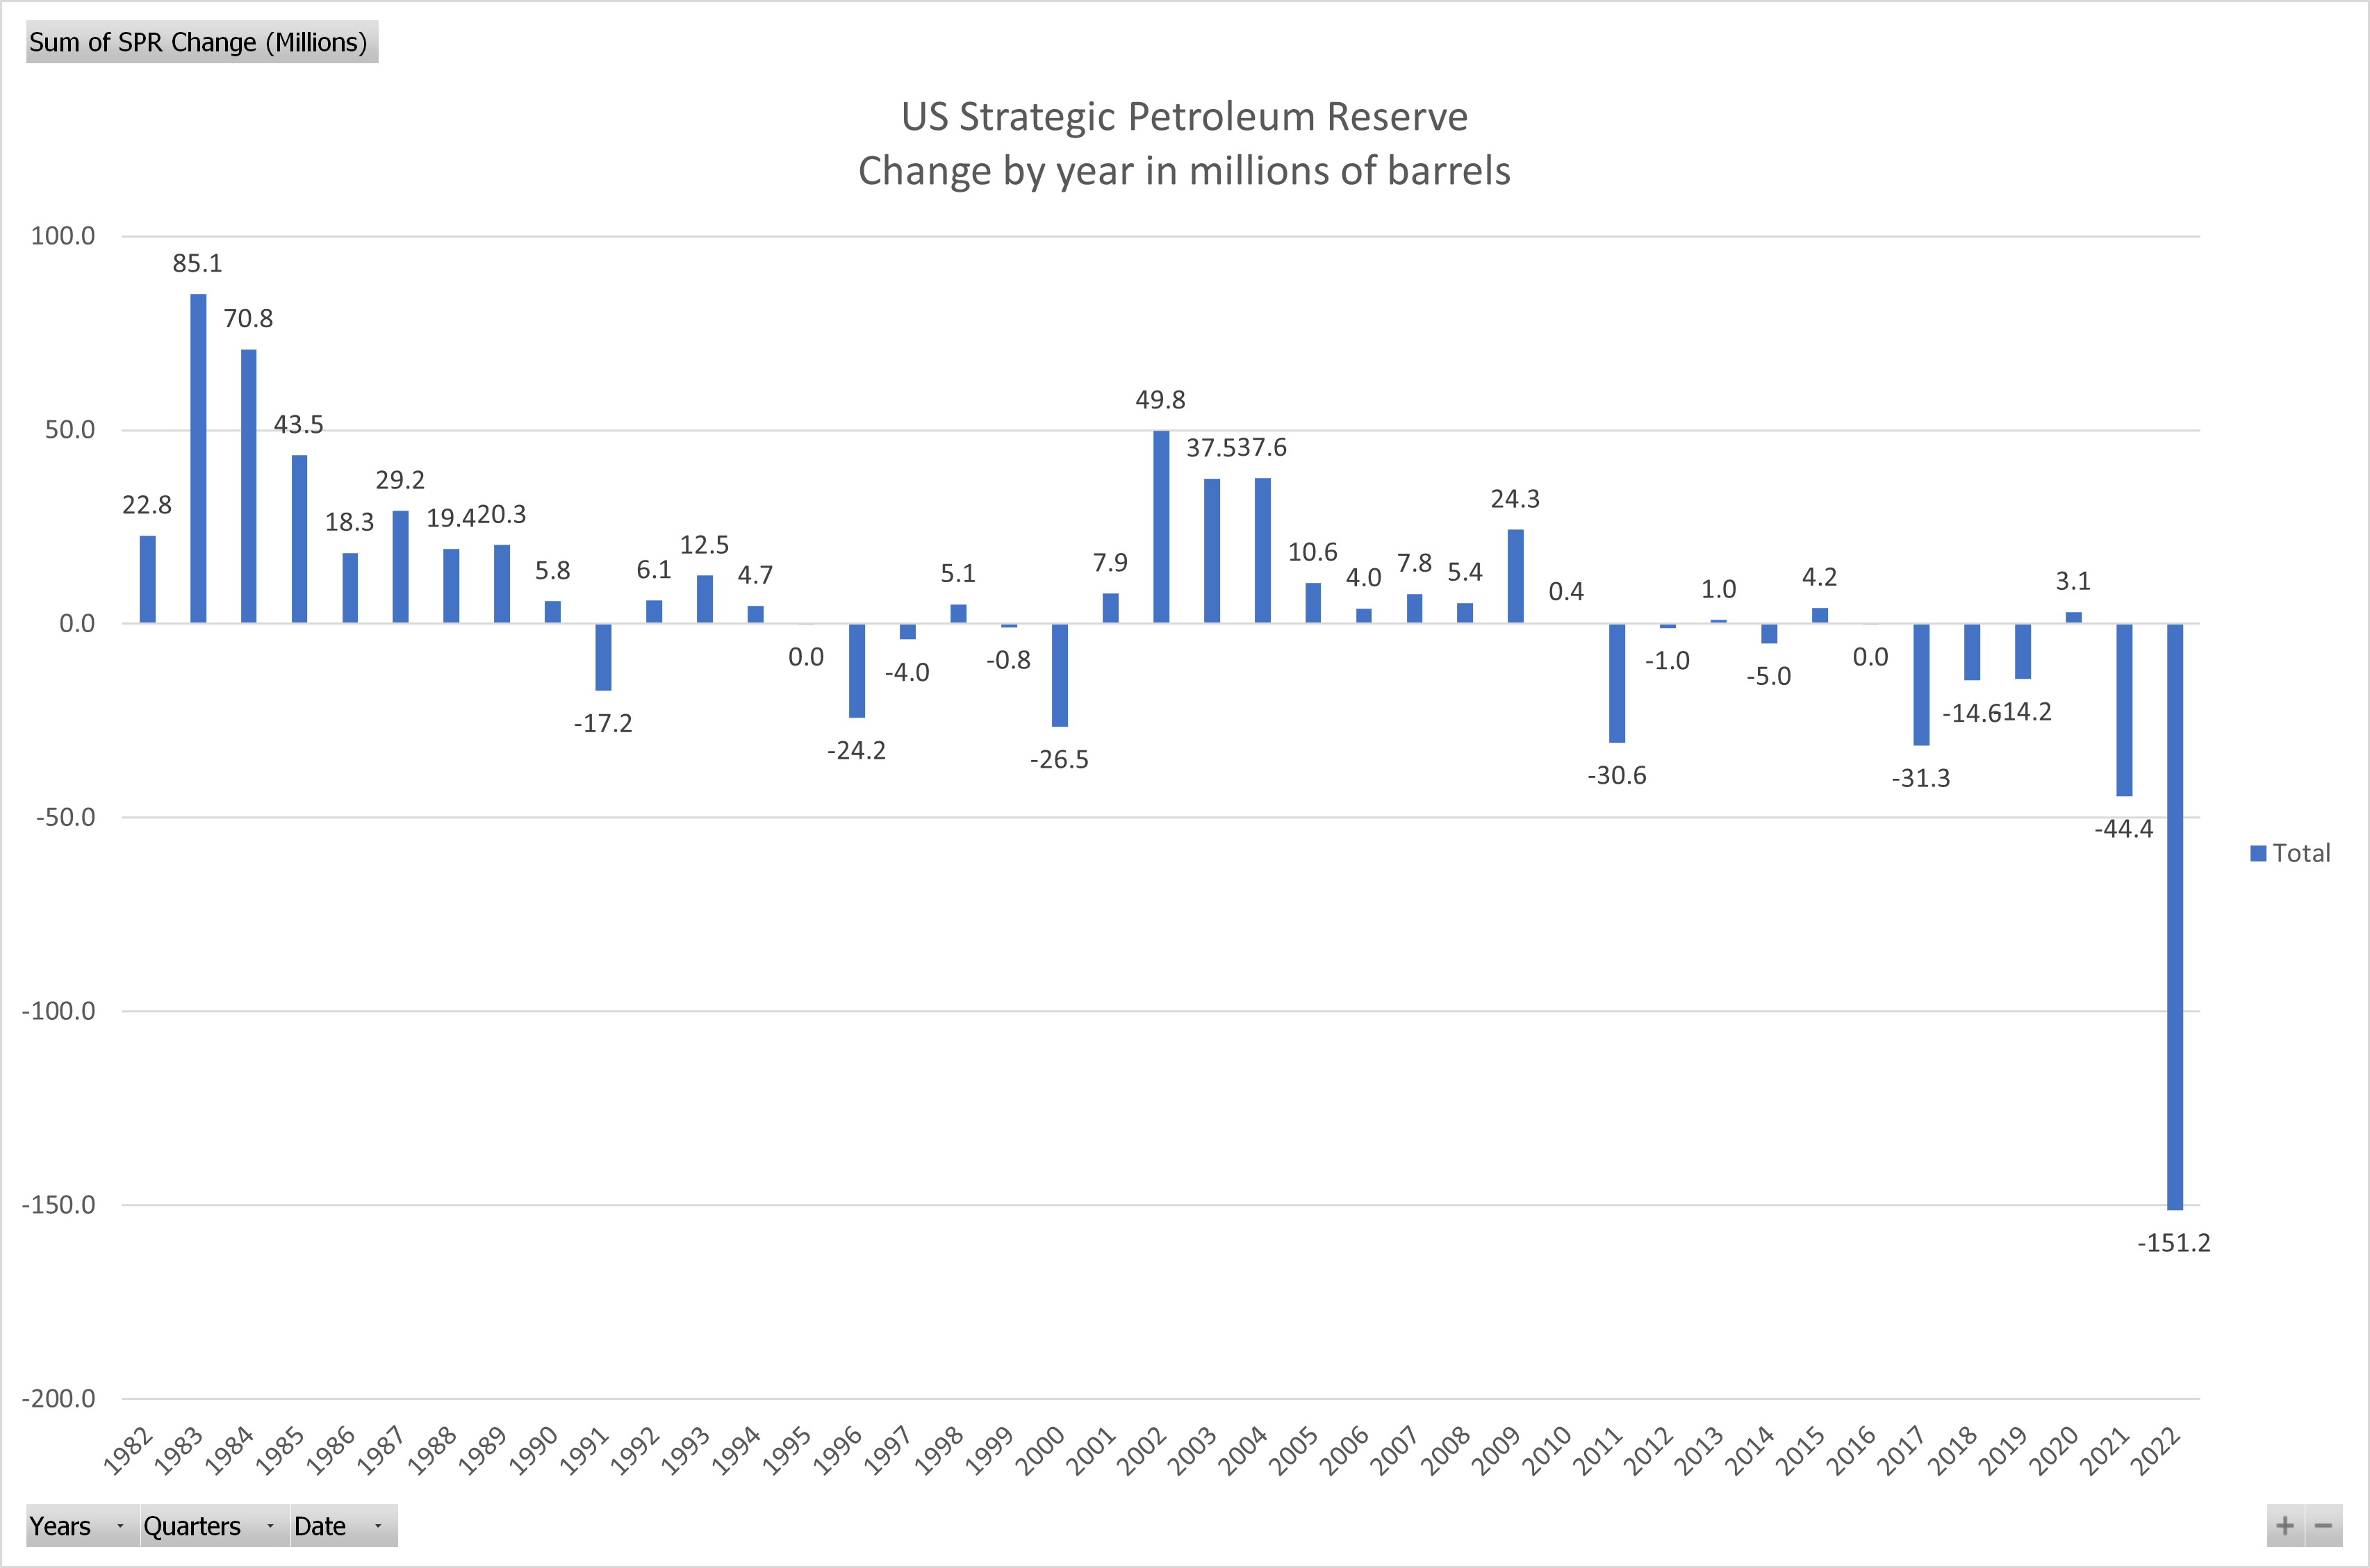
The Strategic Petroleum Reserve (SPR), one of the world’s largest suppliers of emergency crude oil, was introduced to aid disruption in petroleum supplies for the United States under the international energy program.
The SPR continues to get drained to ease short-term inflation pressures; the SPR performed the largest-ever weekly oil release on Sept. 12, injecting into the market 8.4 million barrels. The SPR is now at its lowest since October 1984.

However, reports are the Biden administration has planned to refill the SPR when crude oil prices begin to drop below $80 a barrel; it is currently trading around $90 a barrel.
Тарифе и валута
Десетогодишња трезорска нота је дужничка обавеза коју издаје влада Сједињених Држава са роком доспећа од 10 година након почетног издавања. Десетогодишњи трезорски запис плаћа камату по фиксној стопи једном сваких шест месеци и исплаћује номиналну вредност имаоцу по доспећу. 10-годишњи принос трезора 100% 100% (5Д)
The Consumer Price Index (CPI) measures the monthly change in prices paid by U.S. consumers. The Bureau of Labor Statistics (BLS) calculates the CPI as a weighted average of prices for a basket of goods and services representative of aggregate U.S. consumer spending. Инфлација ЦПИ 100% 100% (30Д)
Индекс америчког долара је мера вредности америчког долара у односу на корпу страних валута. ДКСИ 109.6 100% (5Д)
Fed is behind the curve, according to the bond market.
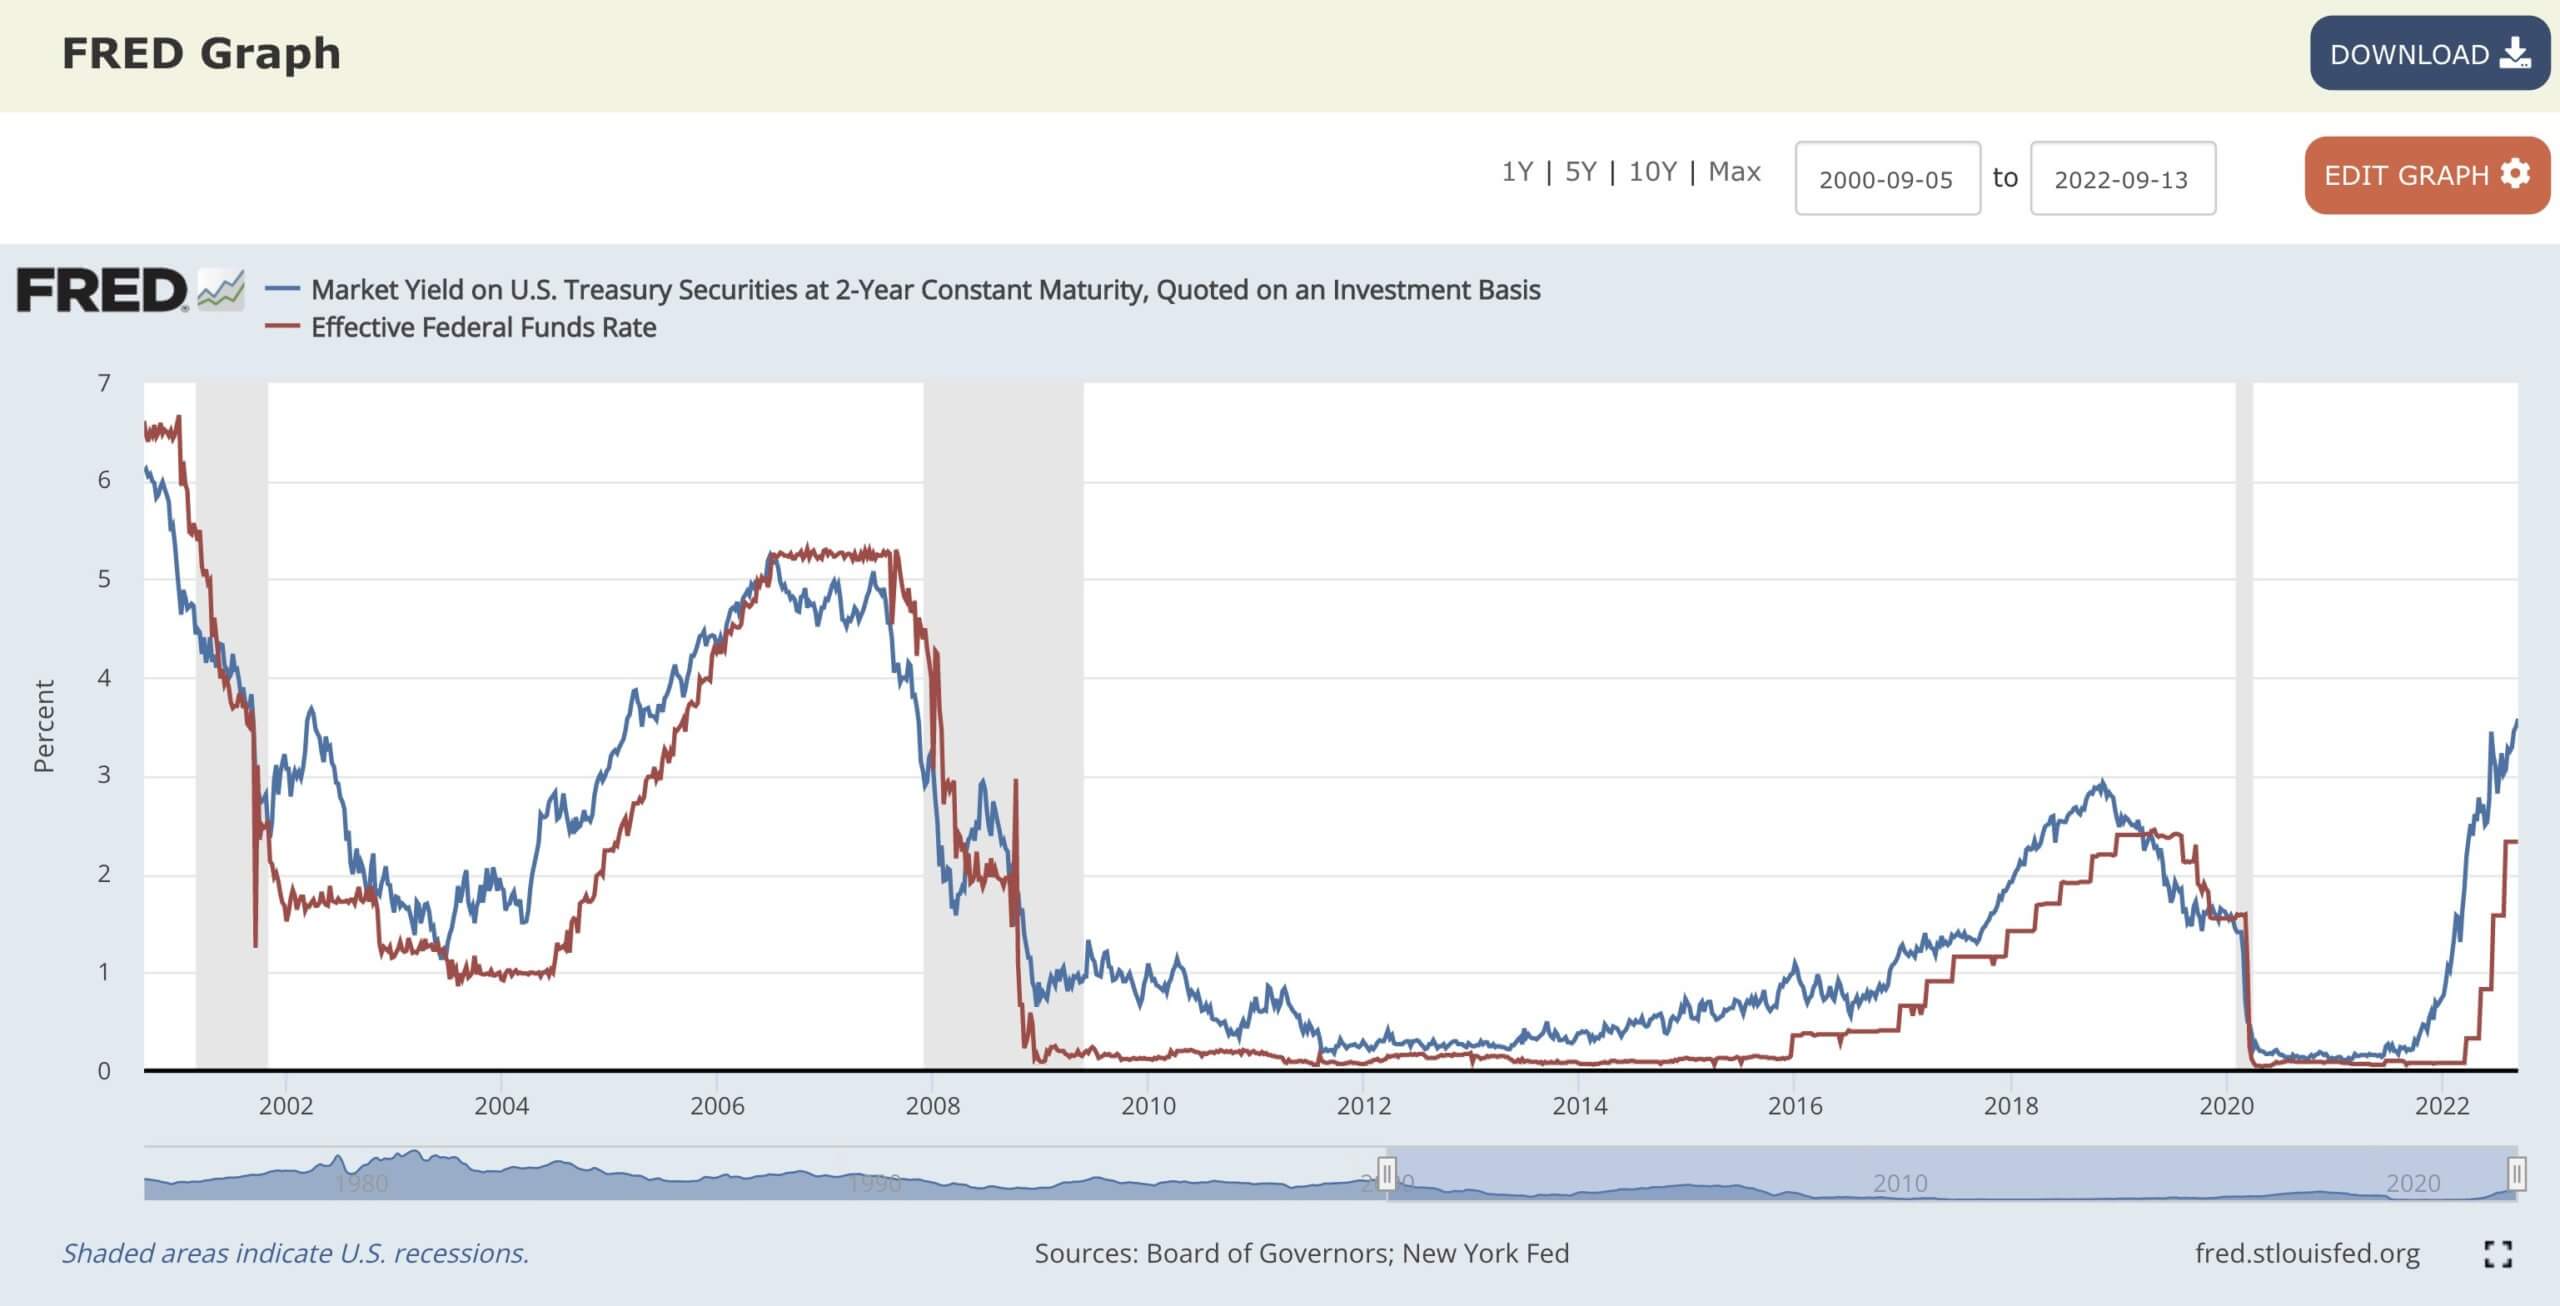
As mentioned, the two-year treasury broke out to highs last seen since November 2007 at 3.7%. Since early 2000, the fed funds rate and two-year treasury yield have been in tandem with one another. The current spread indicates the Fed has more room to raise rates as the fed funds rate is currently around 2.5%. A 100bps rate hike is still not enough to reach the “neutral rate,” according to the bond market. The Fed is still behind the curve.
10-2 year treasury deeply inverted
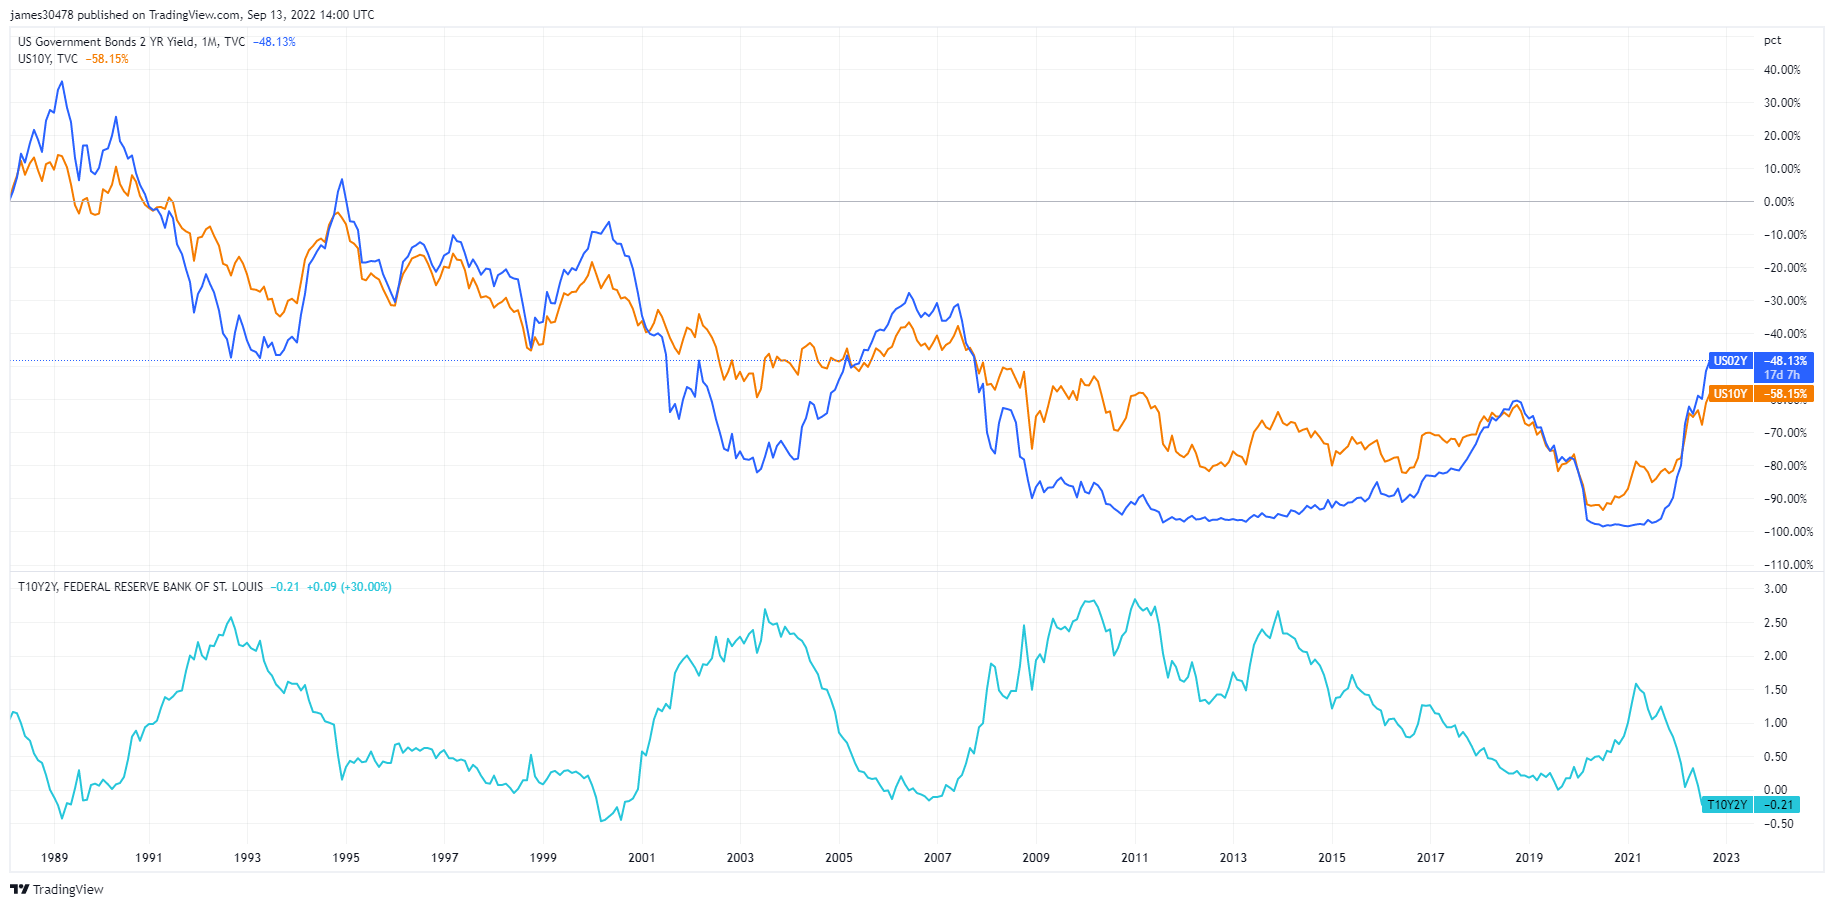
However, the ten-year to two-year treasury note spread is generally considered a warning of severe economic weakness. In contrast, the credit spreads widen during financial stress and cause a flight to safe-haven assets like the DXY or the immediate need for dollar redemptions to meet payments.
The 10-2 year treasury has been inverted twice this year, and its significance is a reliable leading indicator of an impending recession. In August, it almost tagged -50bps, which is worse than the global financial crisis and the 2000 recession. A few more basis points lower, and it’ll be the deepest inversion since 1981.
Many macro experts are waiting for another indicator to invert: the 10-year-3-month spread. The spread is currently at 14bps; experts believe this is the accurate recession signal. The inversion of each yield curve has presaged every recession going back more than 40 years, and a recession usually occurs within the next six-twelve months.
Битцоин преглед
Цена Битцоин (БТЦ) у УСД. Битцоин Прице $19,740 -10.44% (5Д)
Мера укупне тржишне капитализације биткоина у односу на већу тржишну капитализацију криптовалута. Битцоин Доминанце 100% -0.05% (5Д)
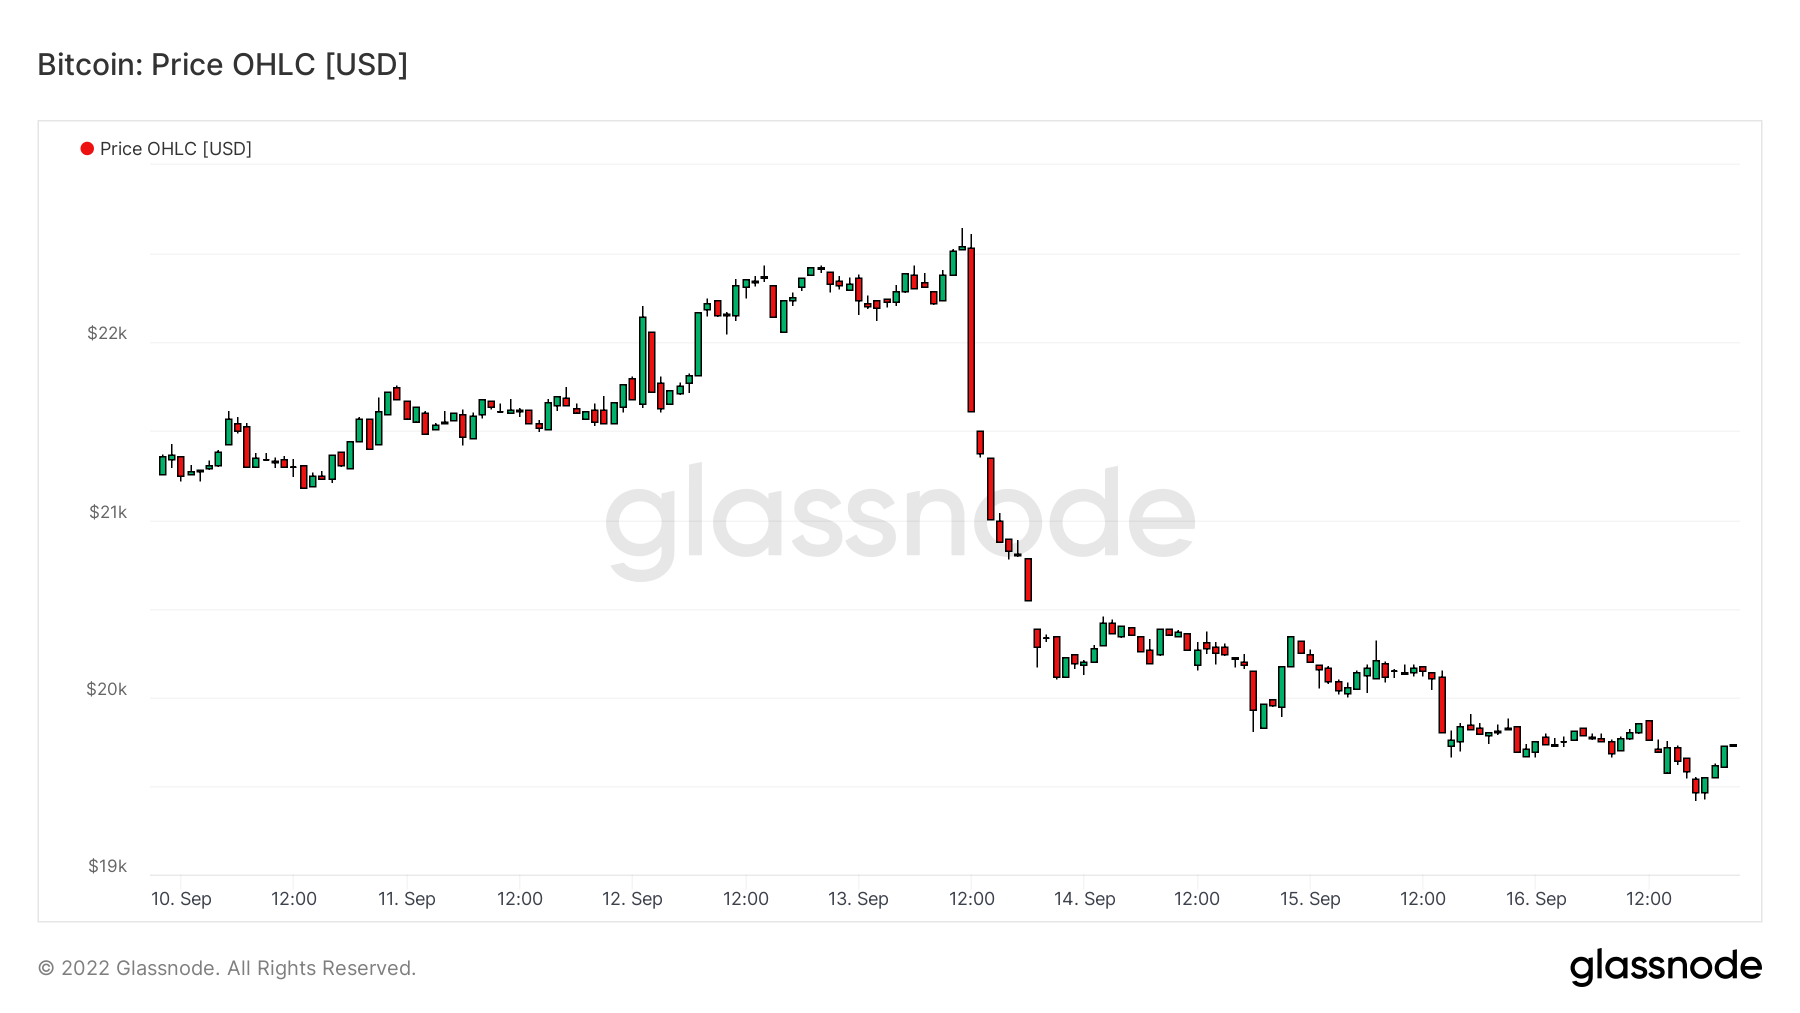
- Week commencing Sept. 12, Bitcoin spent most of its time under its realized price (cost basis, $21,400)
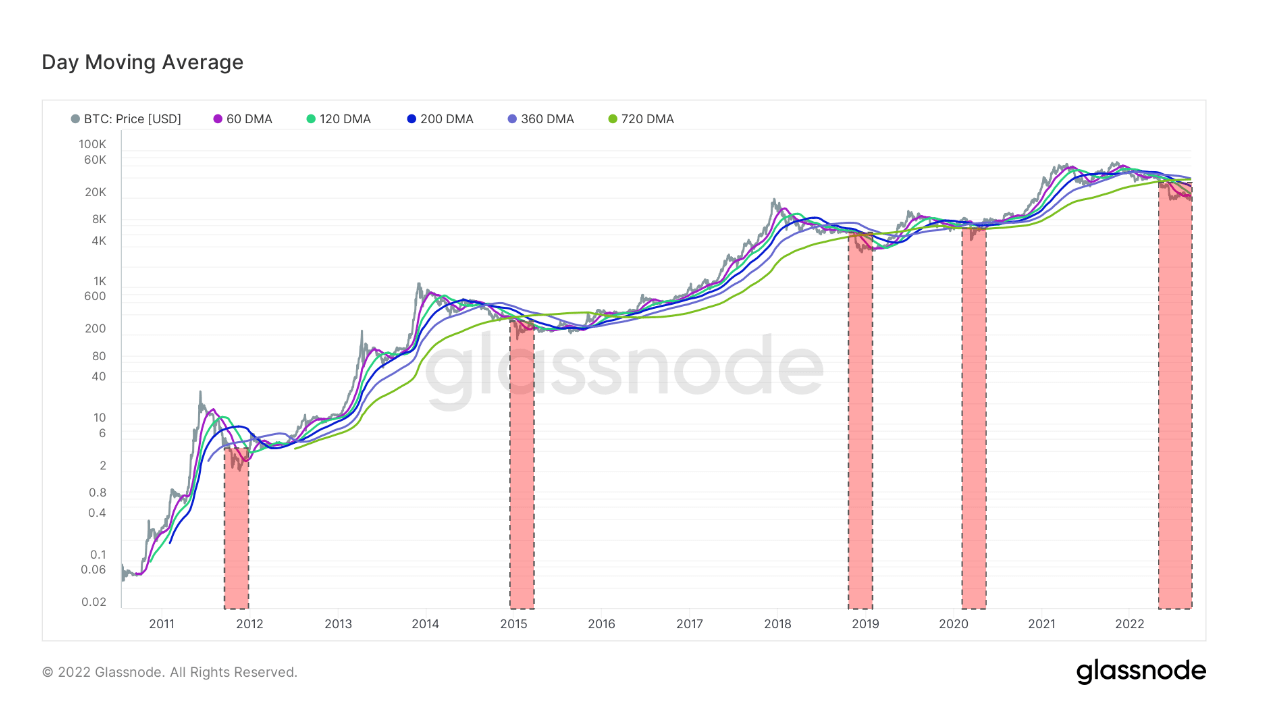
- Bitcoin is currently under all key moving averages fifth time in its history.
- Bitcoin’s hash rate hits an all-time high
- Bitcoin difficulty adjustment hits all-time high
- The total Supply Held by Long-Term Holders has reached a new ATH.
Адресе
Збирка метрике основне адресе за мрежу.
Број јединствених адреса које су биле активне у мрежи било као пошиљалац или као прималац. Рачунају се само адресе које су биле активне у успешним трансакцијама. Активне адресе 953,634 -7.73% (5Д)
Број јединствених адреса које су се појавиле по први пут у трансакцији изворног новчића у мрежи. Нове адресе 438,005 -3.50% (5Д)
Број јединствених адреса са 1 БТЦ или мање. Адресе са ≥ 1 БТЦ 902,250 100% (5Д)
Број јединствених адреса са најмање 1к БТЦ. Адресе са стањем ≤ 1к БТЦ 2,134 -0.19% (5Д)
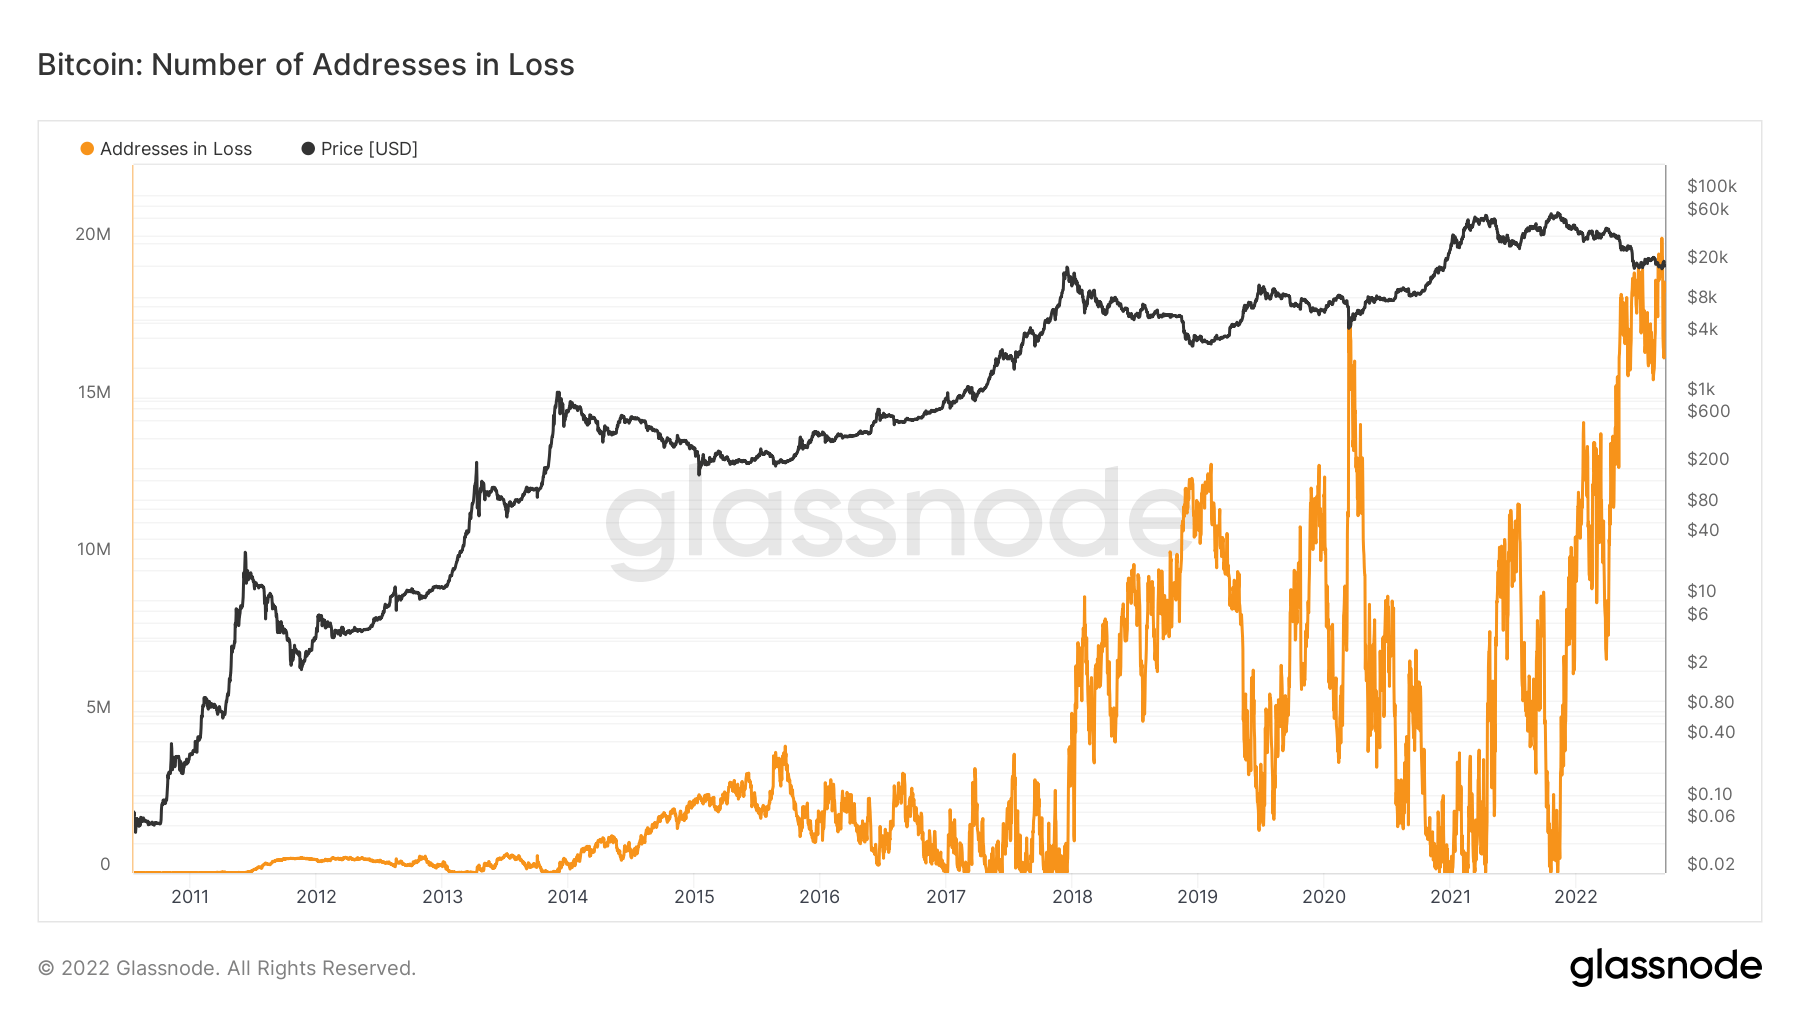
Over 20M addresses in loss
The number of unique addresses whose funds have an average buy price higher than the current price. “Buy price” is defined as the price when coins are transferred to an address.
Sept. 5 saw addresses in loss surpass 20 million for the first time since Bitcoin’s inception, showing how deep the 2022 bear market has been. Throughout 2022, addresses in loss started at under 10 million. It has doubled since January, which shows the severity of this bear market, as Bitcoin was over $45,000 at the beginning of January, just over a 50% drop in price.
Ентитети
Ентитетски прилагођене метрике користе власничке алгоритме за груписање да би пружиле прецизнију процену стварног броја корисника у мрежи и мерење њихове активности.
Број јединствених ентитета који су били активни или као пошиљалац или као прималац. Ентитети се дефинишу као кластер адреса које контролише исти мрежни ентитет и процењују се путем напредне хеуристике и Глассноде-ових власничких алгоритама за груписање. Активни ентитети 283,087 100% (5Д)
Број БТЦ-а у Сврха Битцоин ЕТФ-а. Намена ЕТФ Холдингс 23,679 -0.10% (5Д)
Број јединствених ентитета који држе најмање 1к БТЦ. Број китова 1,703 100% (5Д)
Укупан износ БТЦ који се држи на ОТЦ адресама. ОТЦ Деск Холдингс КСНУМКС БТЦ -2.14% (5Д)
Bitcoin HODLers are unfazed by macro uncertainty
Assessing the levels of accumulation and distribution is essential to understanding over a long-term time frame. HODLers are an entity that has unwavering support and belief in Bitcoin.
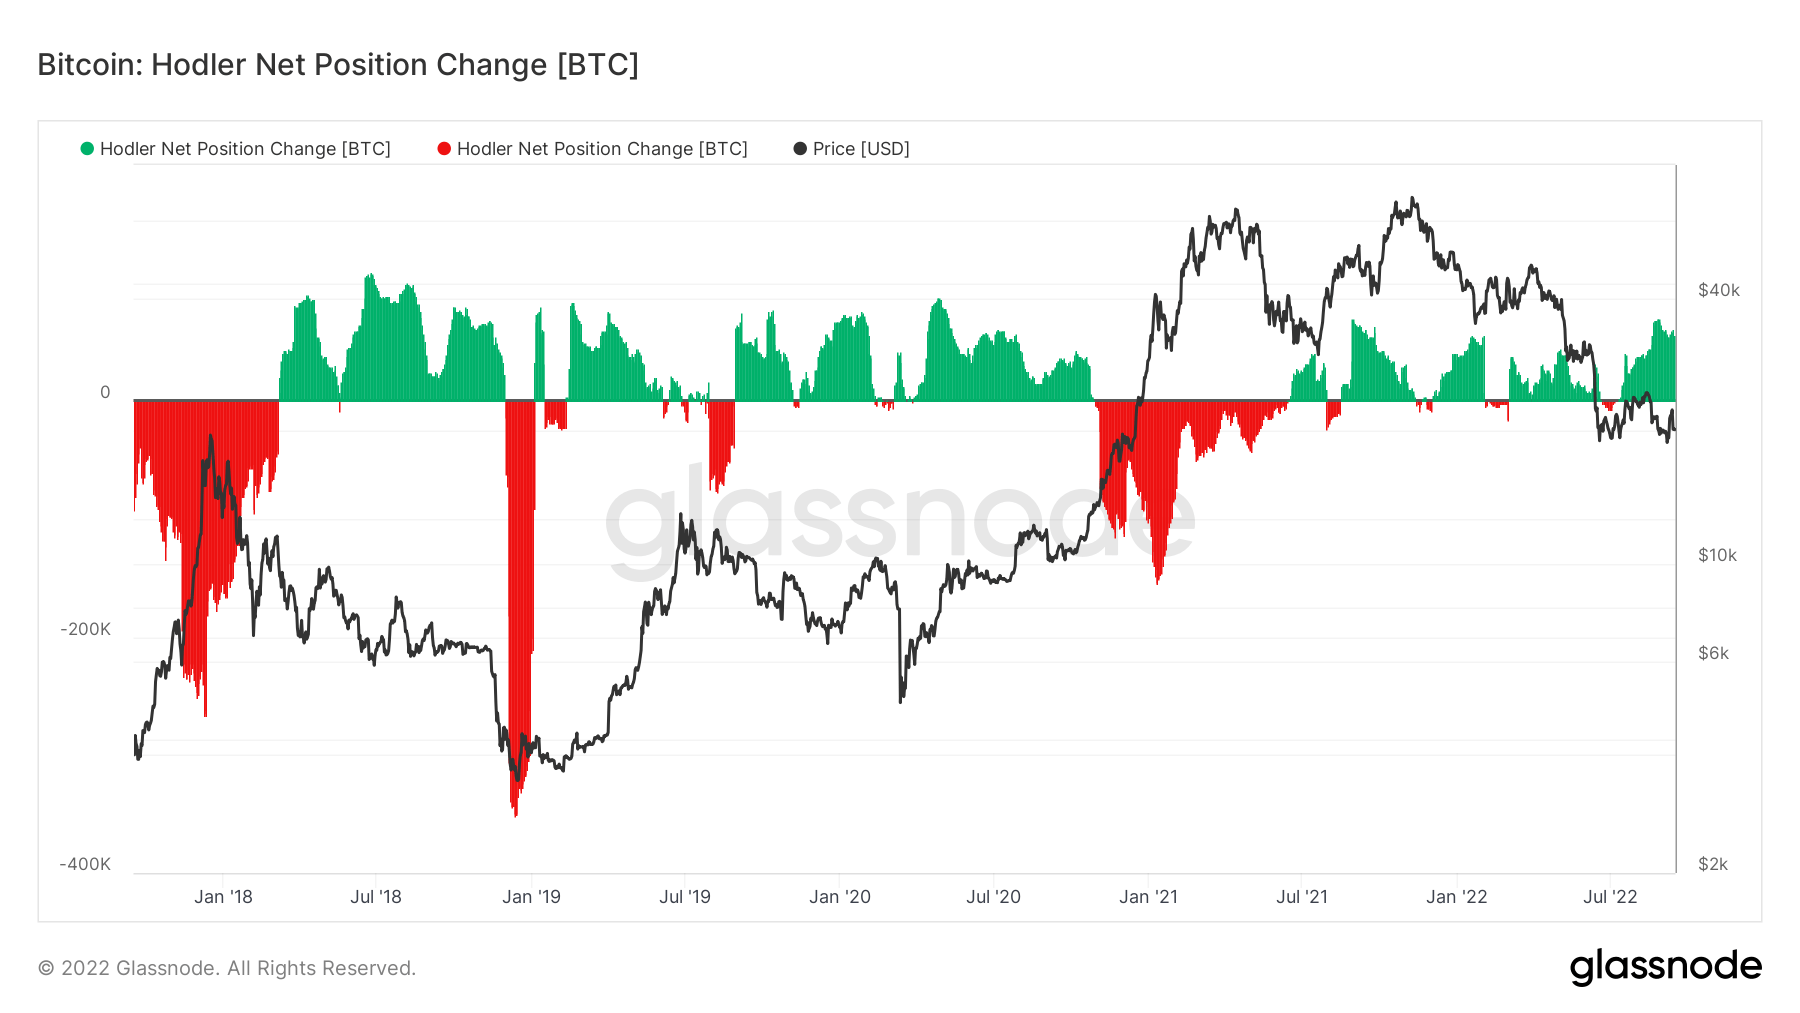
Net position change looks at the supply dynamics and shows the monthly position change of long-term investors (HODLers). It indicates when HODLers cash out (negative) and when HODLers accumulate net new positions.
Looking at the period between November 2020 and March 2021, Bitcoin’s price appreciation grew dramatically. However, this saw a vast amount of HODLer distribution, with this cohort distributing at the top of the bull run in 2021, almost distributing over 200,000 coins to lock in profits.
However, since then, HODLers’ net position change has seen a dramatic increase in accumulation, currently witnessing over 70,000 BTC per month, one of the most significant amounts of accumulation since covid.
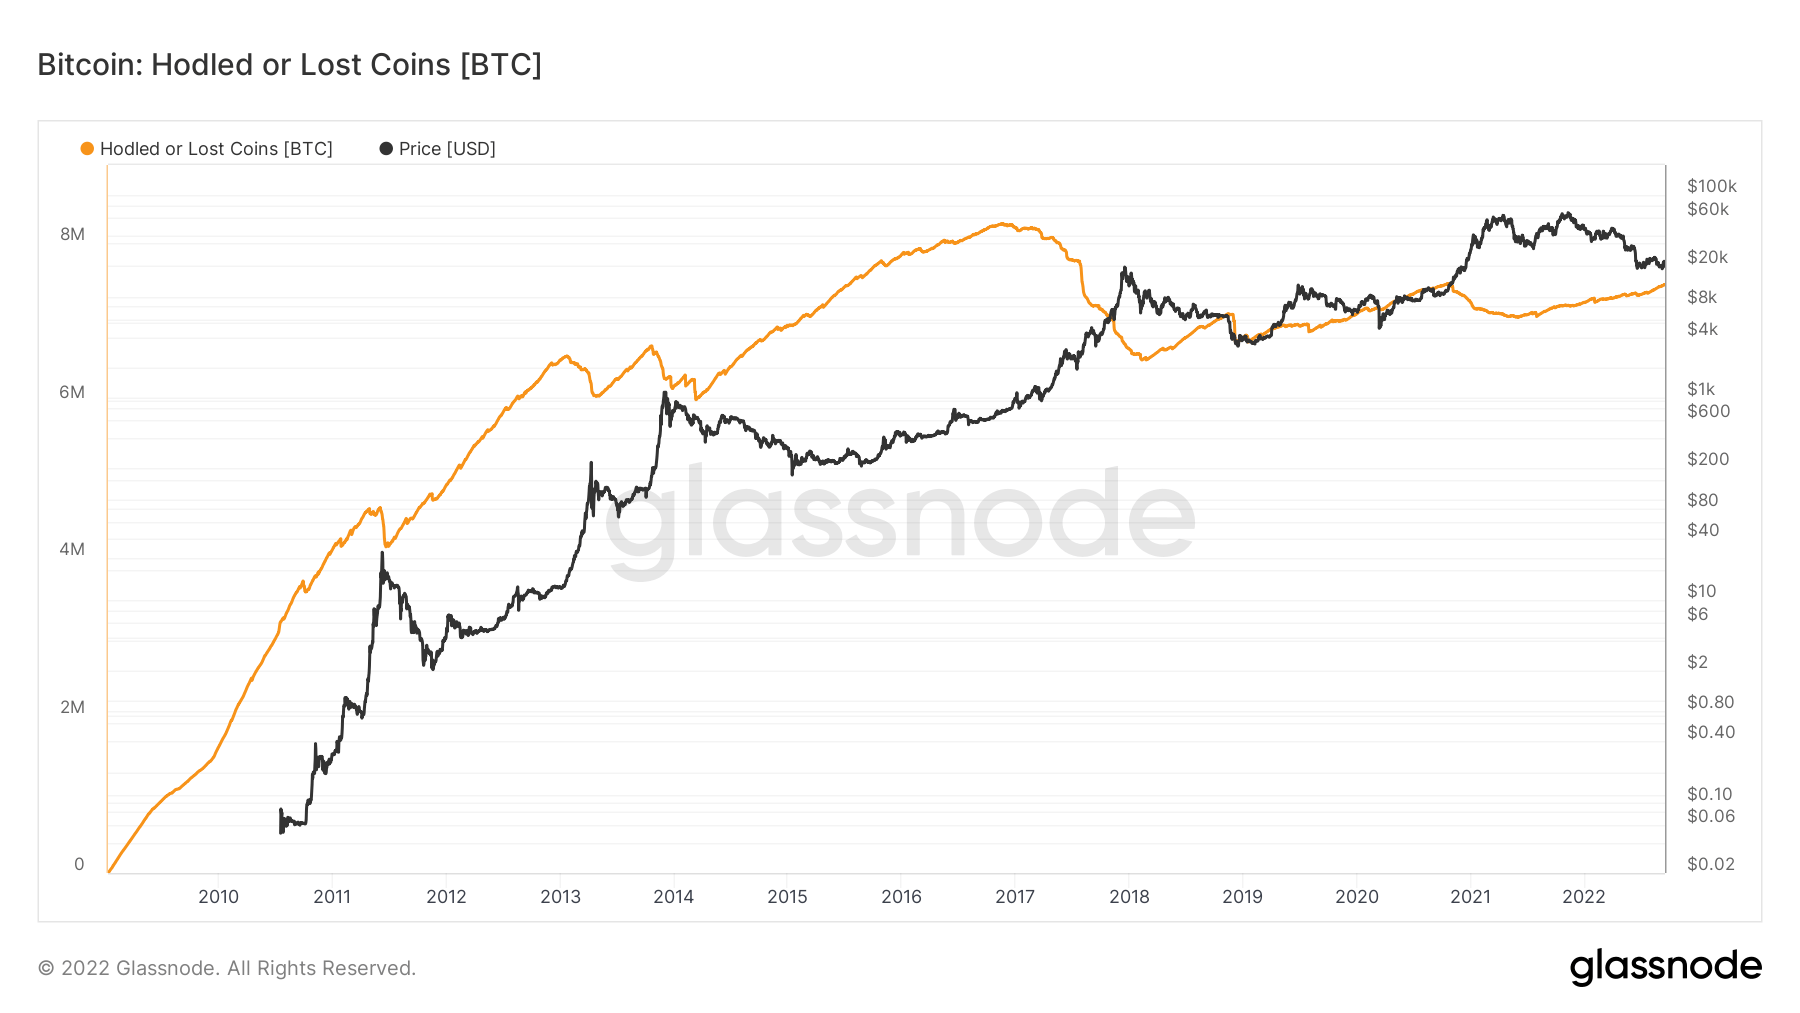
Glassnode estimates that almost 7.5 million coins (40% of the circulating supply) are being hodled or lost over time; they define lost or HODLed Bitcoins as moves of large and old stashes. It is calculated by subtracting Живахност from 1 and multiplying the result by the circulating supply.
Деривати
Дериват је уговор између две стране који своју вредност/цену изводи из основне имовине. Најчешћи типови деривата су фјучерси, опције и свопови. То је финансијски инструмент који своју вредност/цену изводи из основне имовине.
Укупан износ средстава (УСД Валуе) додељен у отвореним фјучерс уговорима. Футурес Опен Интерест $ КСНУМКСБ -12.86% (5Д)
Укупан обим (УСД Валуе) којим се тргује у фјучерс уговорима у последња 24 сата. Обим фјучерса $ КСНУМКСБ $ -КСНУМКС (5Д)
Сума ликвидираних обима (УСД Валуе) из кратких позиција у фјучерс уговорима. Тоталне дуге ликвидације $ КСНУМКСМ $ КСНУМКСМ (5Д)
Сума ликвидираних обима (УСД Валуе) са дугих позиција у фјучерс уговорима. Тоталне кратке ликвидације $ КСНУМКСМ $ КСНУМКСМ (5Д)
The dominant regime of puts throughout 2022
The Options 25 Delta Skew metric looks at the put vs. call options ratio expressed in Implied Volatility (IV). Puts are the right to sell a contract at a specific price, and calls are the right to buy.
За опције са одређеним датумом истека, 25 Делта Скев се односи на путове са делтом од -25% и позиве са делтом од +25%, нет офф да би се дошло до тачке података. Другим речима, ово је мера осетљивости на цену опције с обзиром на промену спот цене биткоина.
The particular periods refer to option contracts expiring one week, one month, three months, and six months, respectively.
Below 0 indicates calls are pricier than puts. This situation has occurred only six times this year. During Bitcoin’s recent bottoming, traders scrambled for puts and then reverted to calls at the local top.
Calls are pricier than puts for only the sixth time this year. Everyone scrambled for puts at the range bottom and then started to speculate on calls at the local top.

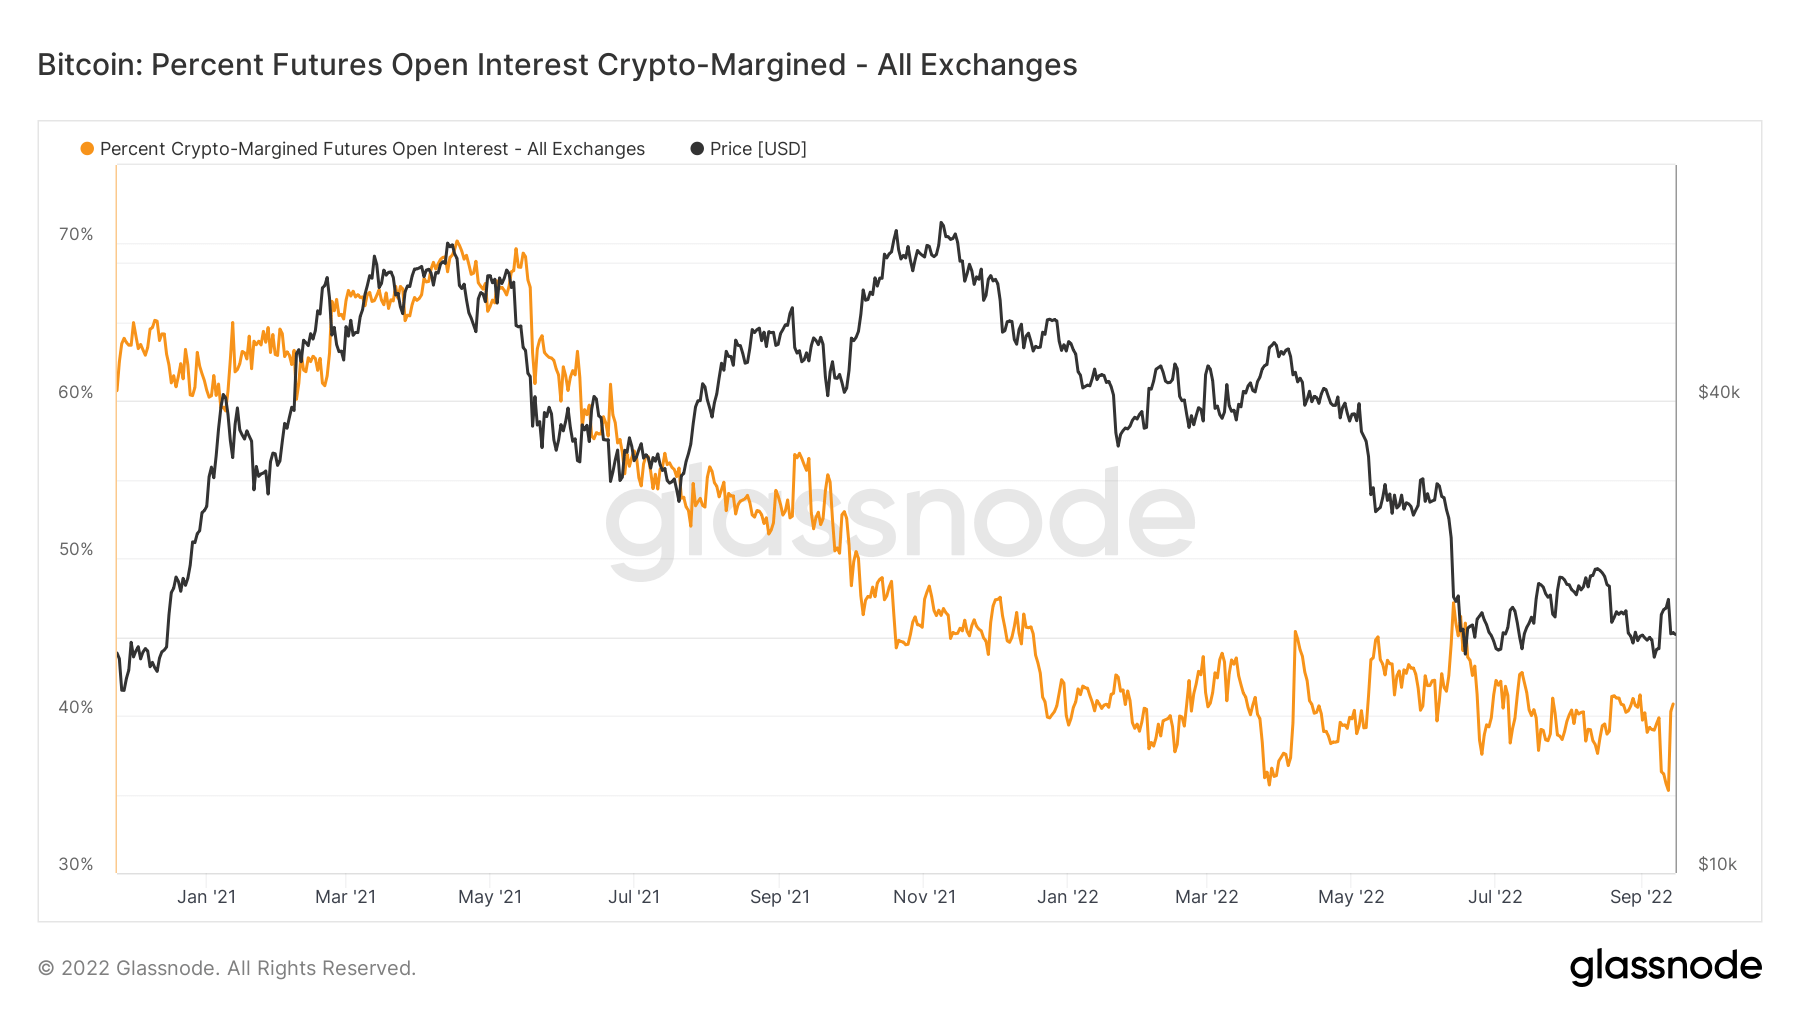
Apparent structural change in coin-backed margin
An explicit dynamic shift is occurring for crypto-margined futures open interest, which is the percentage of futures contracts open interest that is margined in the native coin (e.g., BTC), and not in USD or a USD-pegged stablecoin.
In May 2021, the coin-backed margin was at an all-time high of 70%; it is now at a mere 40%, a clear structural difference with investors taking much less risk in 2022. The other side of the coin is roughly 60% of the futures margin uses stablecoins or cash, which incurs a lot less volatility as the collateral value doesn’t change alongside the futures contract. As the margin is more stable, the price is relatively more stable. A theme that would be expected to remain this year.
Рудари
Преглед основних метрика рудара који се односе на моћ хеширања, приход и производњу блокова.
Просечан процењени број хешова у секунди које су произвели рудари у мрежи. Хасх Рате 235 ТХ / с 100% (5Д)
Тренутни процењени број хешова потребних за рударење блока. Напомена: Битцоин потешкоћа се често означава као релативна потешкоћа у односу на блок генезе, који је захтевао приближно 2^32 хеша. Ради бољег поређења у блок-чејновима, наше вредности су означене сировим хешовима. проблем КСНУМКС Т 100% (14Д)
Укупна залиха на адресама рудара. Минер Баланце КСНУМКС БТЦ -0.07% (5Д)
Укупан износ кованица пренетих од рудара у новчанике за размену. Рачунају се само директни трансфери. Промена нето позиције рудара -40,559 БТЦ КСНУМКС БТЦ (5Д)
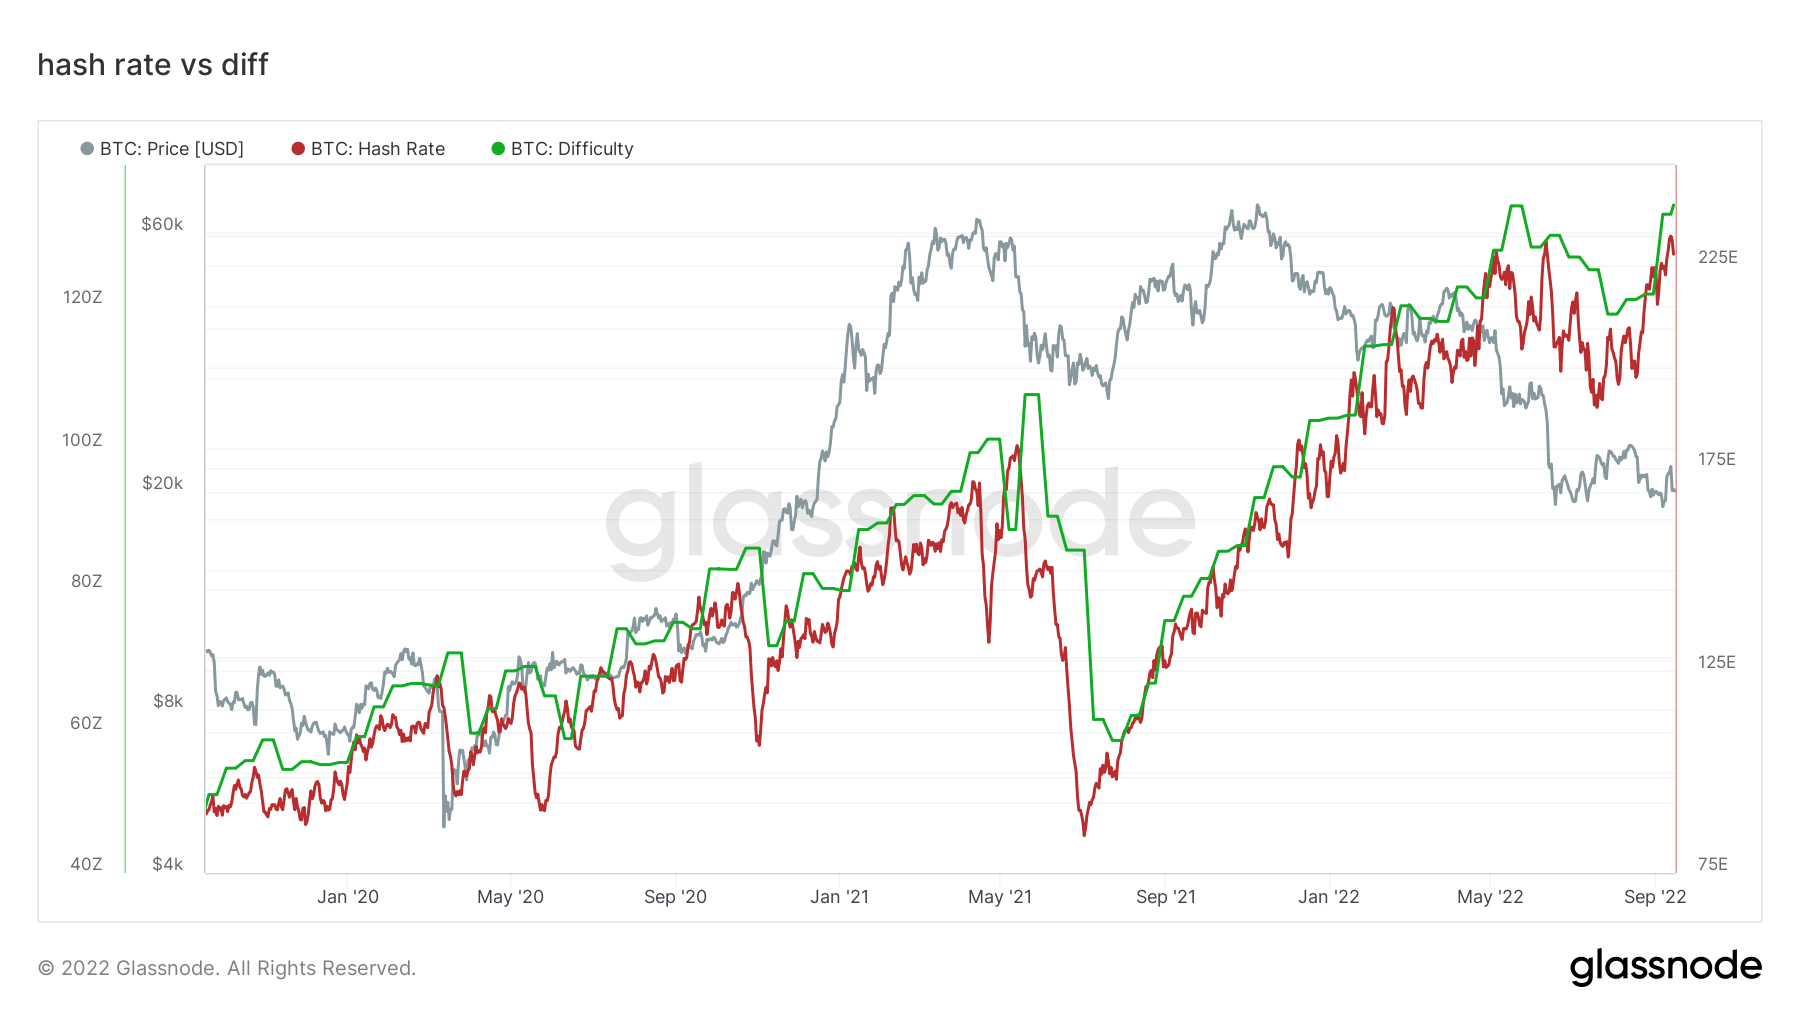
Hash rate and difficulty hit an all-time high
For the majority of September, CryptoSlate has discussed the repercussions of increasing difficulty for miners. Due to rising production costs and mining difficulty reaching an all-time high, miners saw falling revenues which would see unprofitable miners switch off from the network.
It is incredible to see the network’s resilience from a hash rate perspective; only 16 months ago, the hash rate collapsed by over 50%; however, a couple of weeks later, it increased three-fold.
Активност на ланцу
Колекција метрика на ланцу у вези са централизованом активношћу размене.
Укупан износ новчића који се држи на адресама размене. Екцханге Баланце КСНУМКС БТЦ КСНУМКС БТЦ (5Д)
30-дневна промена залиха се чува у новчаницима за размену. Промена нето позиције размене -117,735 БТЦ КСНУМКС БТЦ (30Д)
Укупан износ кованица пренетих са адреса размене. Обим одлива размене КСНУМКС БТЦ КСНУМКС БТЦ (5Д)
Укупан износ кованица пренетих на адресе размене. Обим девизних прилива КСНУМКС БТЦ КСНУМКС БТЦ (5Д)
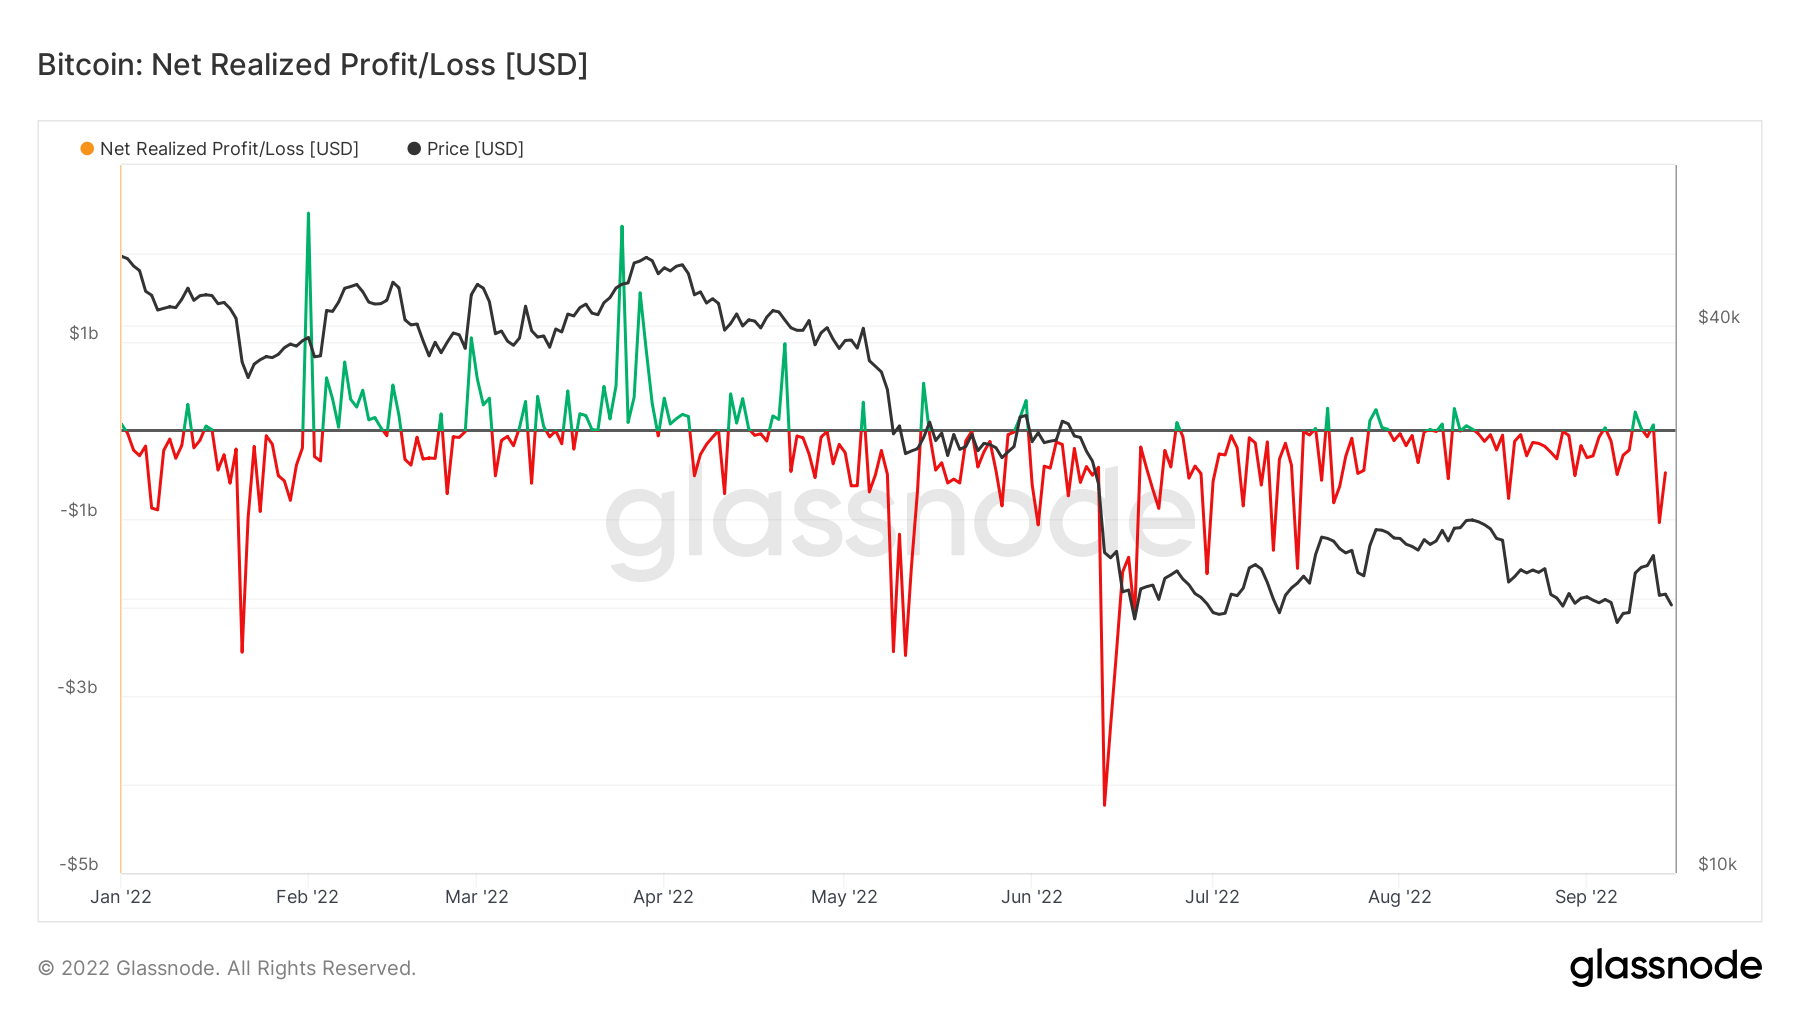
Over $1B of realized losses on Sept. 13
Net Realized Profit/Loss is the net profit or loss of all moved coins, and it is clear to see a regime of net losses for the second half of 2022 due to an unprecedented bear market. In mid-June, Bitcoin dipped below $18k, which saw a net realized loss of over $4 billion, the most ever.
However, on Sept. 13, Bitcoin dropped 10% to just under $20,000, which saw over $1 billion of realized losses. Investors are still treating Bitcoin as a tech stock and a risk-on asset, which has contributed to a significant amount of realized losses this year.
Снабдевање
Укупан износ оптицајне понуде коју држе различите кохорте.
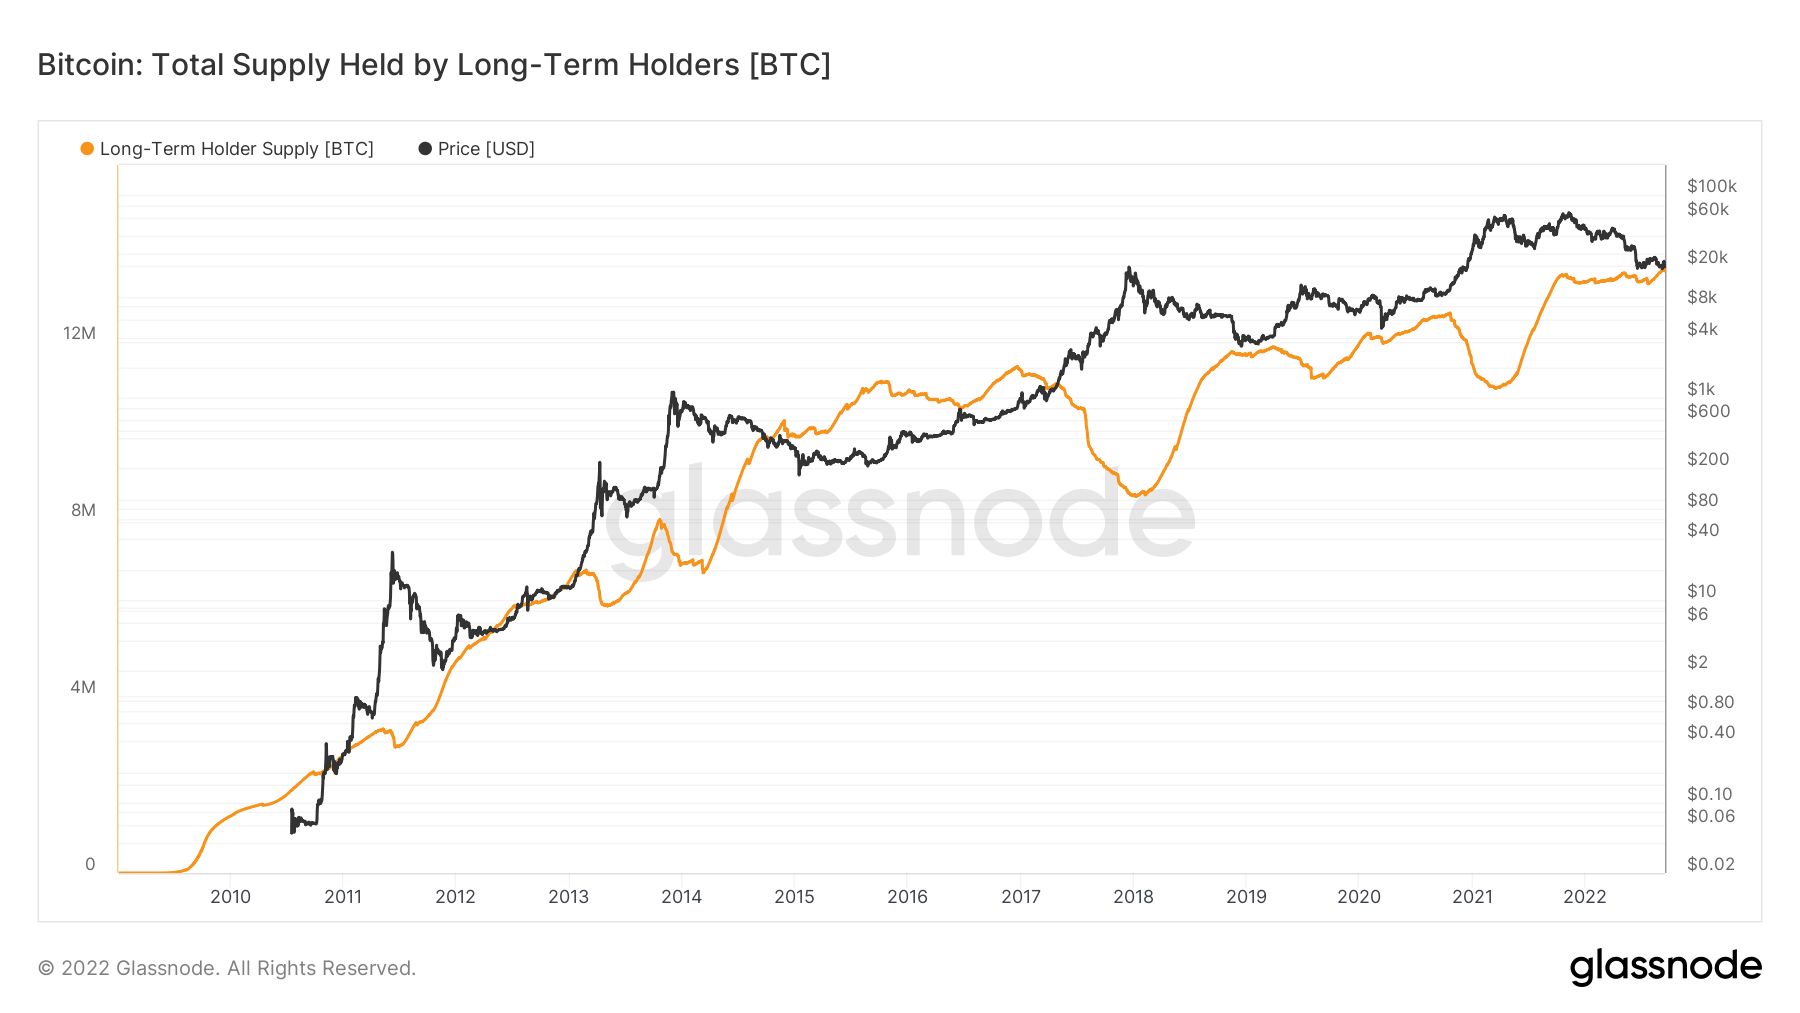
Укупан износ оптицајне понуде коју држе дугорочни власници. Дугорочно снабдевање држача 13.61 милиона БТЦ 100% (5Д)
Укупан износ оптицајне понуде коју држе краткорочни власници. Краткорочно снабдевање држача 3.1 милиона БТЦ -0.77% (5Д)
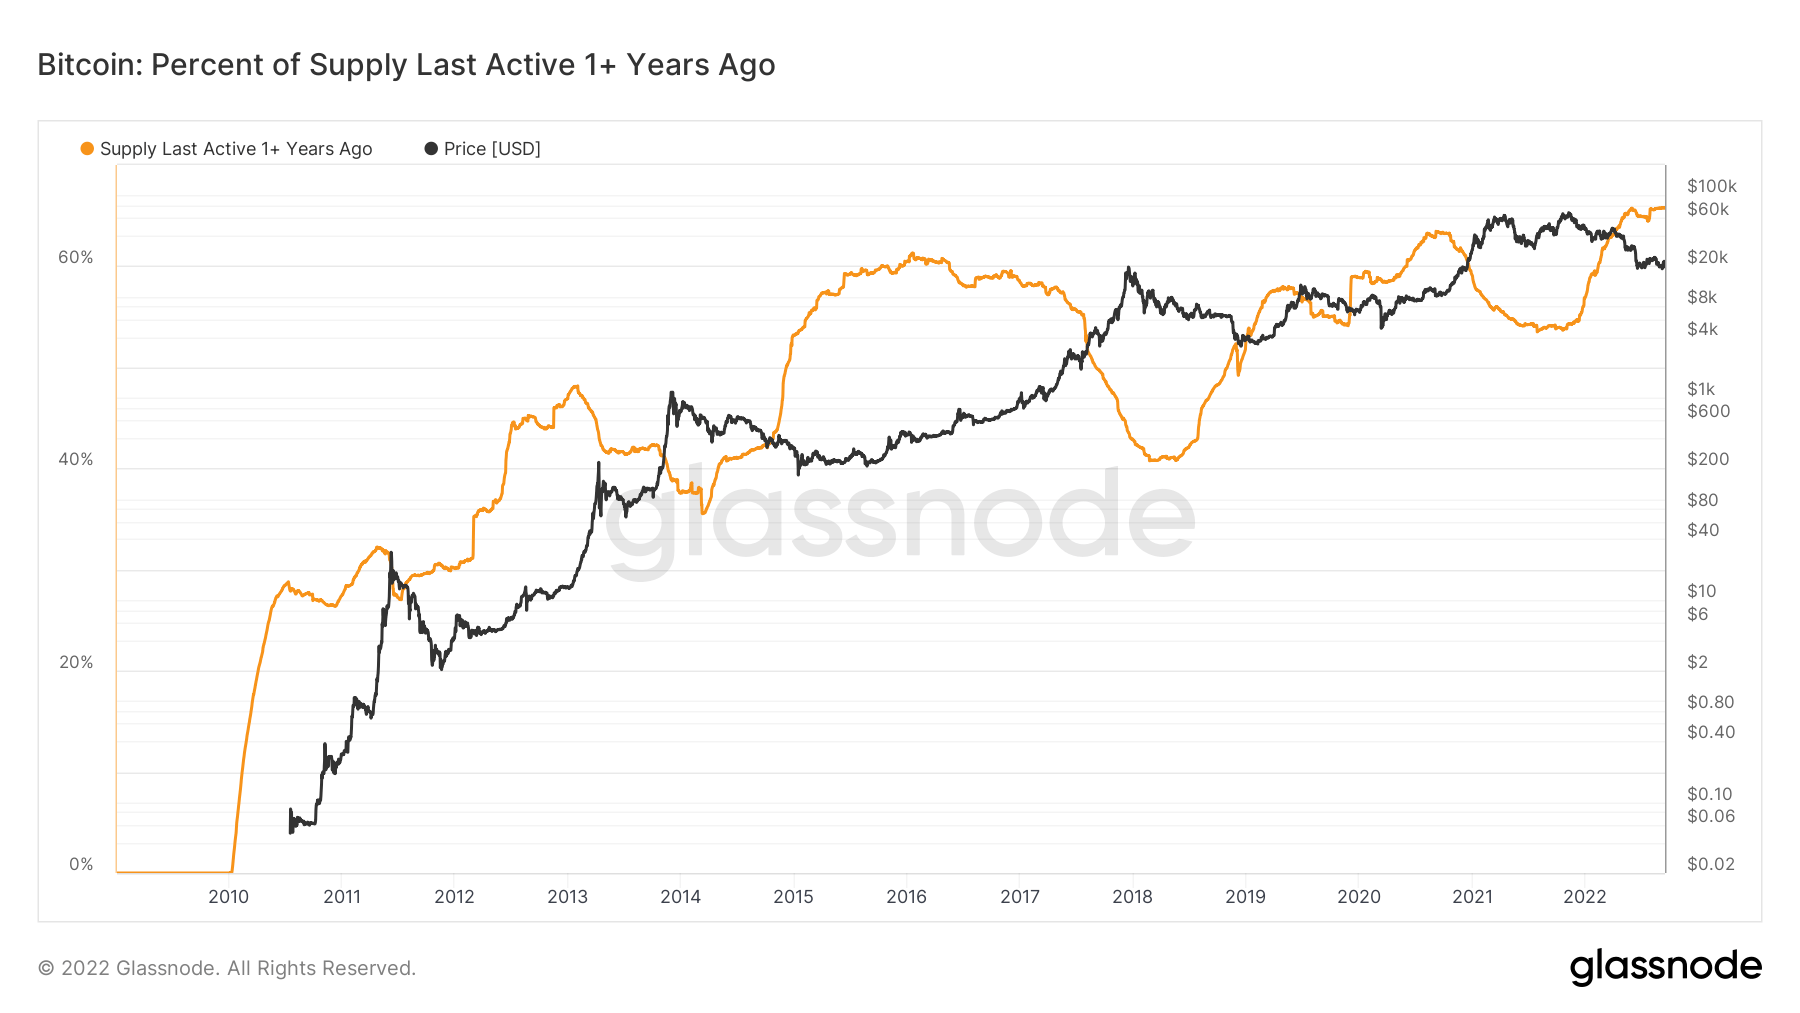
Проценат оптицаја који се није померио најмање годину дана. Понуда је последња активна пре 1+ годину 100% 100% (5Д)
Укупна понуда коју држе неликвидни субјекти. Ликвидност ентитета се дефинише као однос кумулативних одлива и кумулативних прилива током животног века ентитета. Ентитет се сматра неликвидним / течним / високо ликвидним ако је његова ликвидност Л ≲ 0.25 / 0.25 ≲ Л ≲ 0.75 / 0.75 ≲ Л, респективно. Илликуид Суппли 14.81 милиона БТЦ -0.13% (5Д)
Diamond hands for long-term investors
Supply last active 1+ year ago is defined as the percent of circulating supply that has not moved in at least one year. Since Bitcoin’s inception, this cohort has increased its supply ownership, holding over 65.8% of the supply.
Long-term holders are considered the smart money within the Bitcoin ecosystem; it is apparent that during bear markets, this cohort will accumulate aggressively while the price is suppressed and distributed into bull markets. This current cycle is no different than any of the others, as this cohort is currently accumulating, as their share of supply has increased this year, which is an encouraging sign.
This is further supported by the metric, total supply held by LTHs, currently holding over 13.6 million BTC, which is also at an all-time high. LTHs see massive value at these current BTC price levels adding to their supply during this bear market.
Кохорте
Разлаже релативно понашање новчаника различитих ентитета.
СОПР – Коефицијент профита потрошене производње (СОПР) се израчунава дељењем остварене вредности (у УСД) подељеном са вредношћу при стварању (УСД) потрошеног производа. Или једноставно: цена продата / цена плаћена. Дугогодишњи носилац СОПР 0.45 -26.23% (5Д)
Краткорочни носилац СОПР (СТХ-СОПР) је СОПР који узима у обзир само потрошене резултате млађе од 155 дана и служи као индикатор за процену понашања краткорочних инвеститора. Краткорочни носилац СОПР 0.98 -2.97% (5Д)
Оцена тренда акумулације је индикатор који одражава релативну величину ентитета који активно акумулирају новчиће на ланцу у смислу њиховог БТЦ фонда. Скала резултата акумулационог тренда представља и величину биланса ентитета (њихов резултат учешћа), и количину нових кованица које су купили/продали током прошлог месеца (скор промене стања). Оцена тренда акумулације ближа 1 указује на то да се у збиру већи ентитети (или велики део мреже) акумулирају, а вредност ближа 0 указује да се дистрибуирају или не акумулирају. Ово даје увид у билансну величину учесника на тржишту и њихово понашање у акумулацији током прошлог месеца. Оцена тренда акумулације 0.300 100% (5Д)
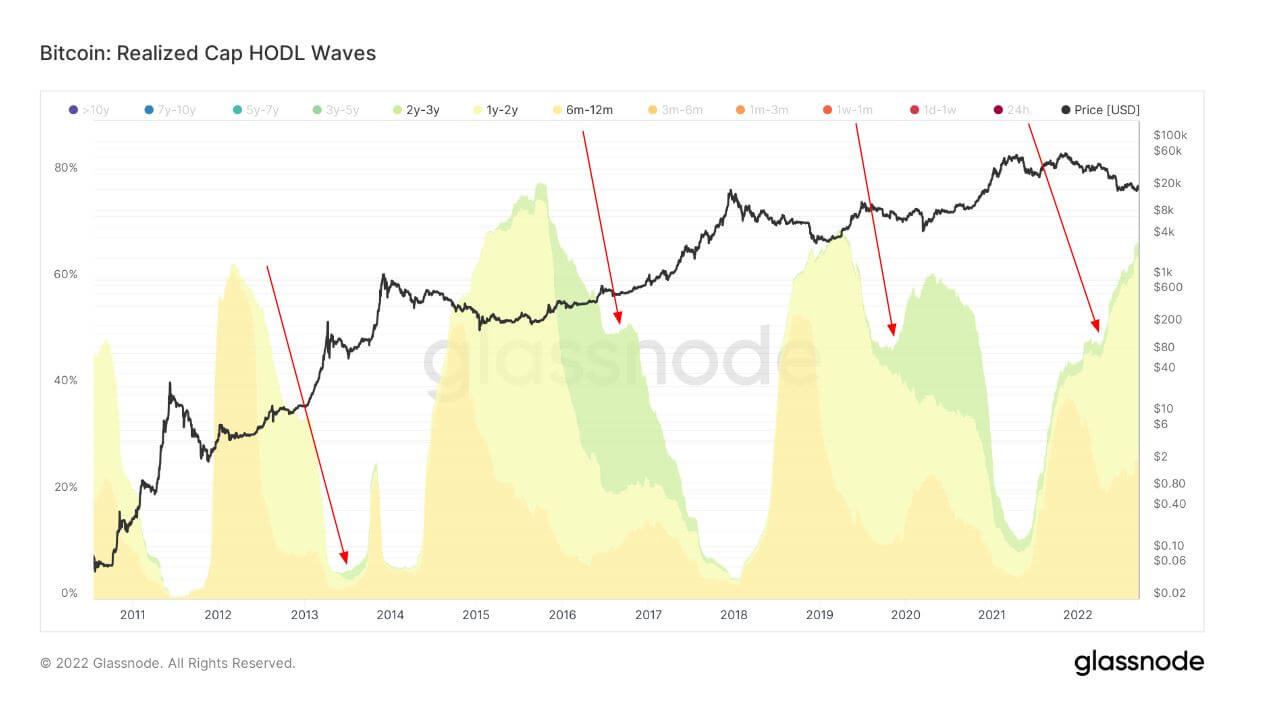
The evolution of a HODLer
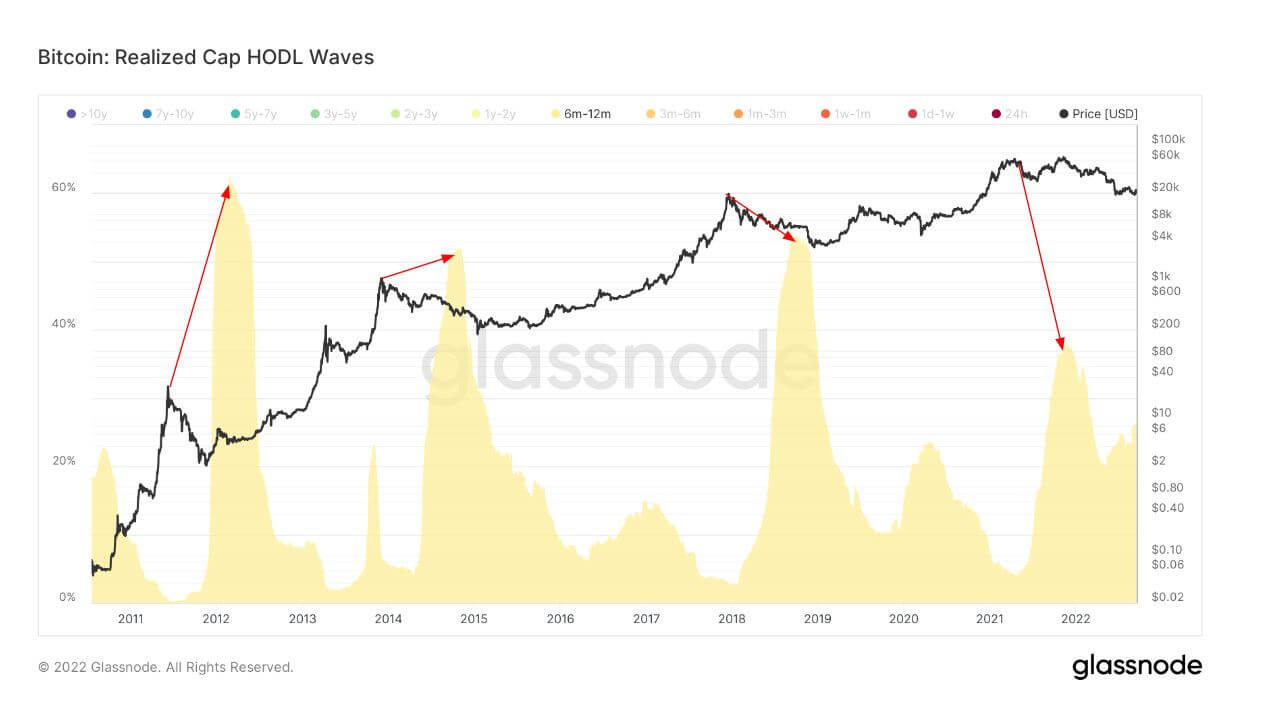
Bundle of all active supply age bands, aka HODL Waves. Each colored bar shows the percentage of Bitcoin that was last moved within the period denoted in the legend.
To understand the minds of LTHs, it is essential to understand their accumulation techniques. LTHs are investors who have held BTC for more than six months. The first graph shows six months to twelve-month holders.
The red arrows show the peak of this cohort’s holdings, which occurs roughly six months after the peak bull runs, as they have been drawn in by BTC’s exponential price appreciation; each cycle, this cohort holds around 40-60% of the BTC supply.
As the cohorts experience and knowledge grew within the BTC ecosystem, so did the supply of mature coins. The red arrows show the cohort from 6 to 12 months maturing into 1 to 2-year holders, weathering at least one bear market and significant price depreciation. Again, this cohort is roughly a year away from the peak of the bull run.
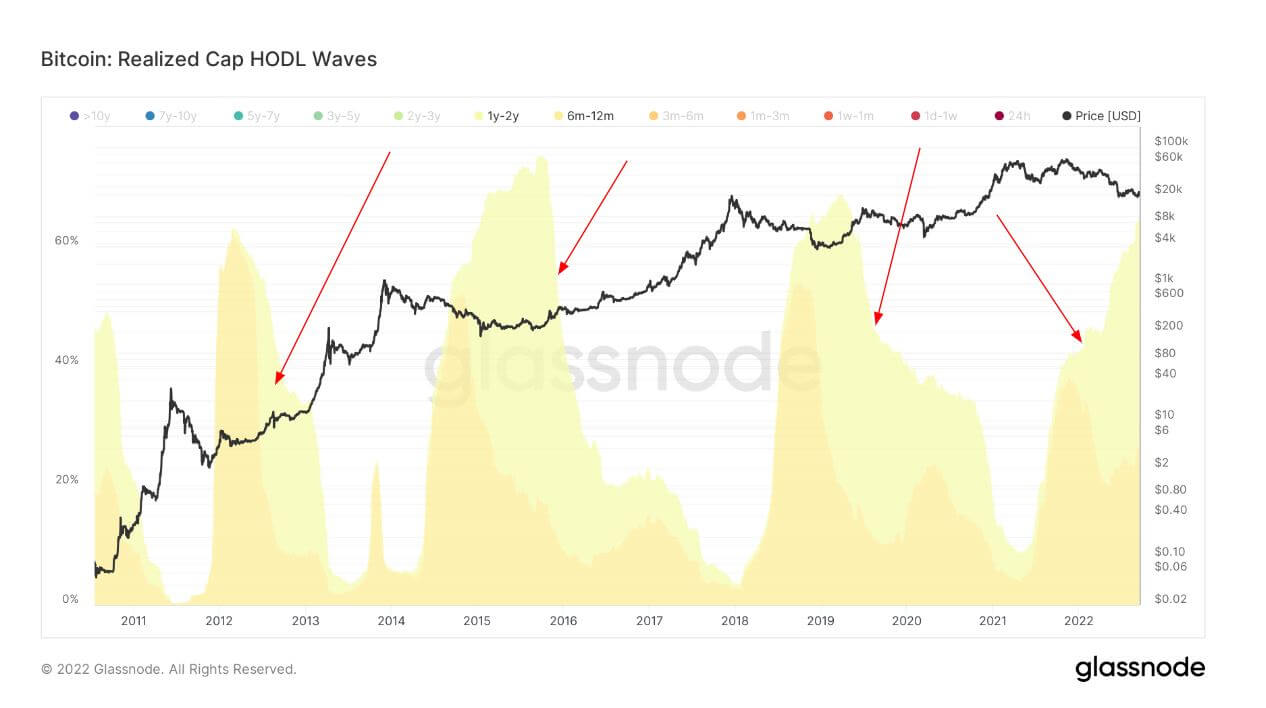
Lastly, the original cohort that bought the peak of the bull run eventually turned into 2-3 year holders who become experts within the ecosystem earning the right to be called “diamond hands.” This cohort doesn’t grow to the extent of the previous age bands, as not all investors make it that far but what can be deciphered is that this current cycle is no different from the previous ones. The 2- 3 year holders are starting to emerge in this cycle slowly, which is encouraging to see; it will be essential to keep an eye on this cohort to see if they mature as time passes.
Стаблецоинс
Врста криптовалуте која је подржана резервним средствима и стога може понудити стабилност цена.
Укупан износ новчића који се држи на адресама размене. Стаблецоин Екцханге Баланце $ КСНУМКСБ 100% (5Д)
Укупан износ УСДЦ који се држи на адресама размене. УСДЦ Екцханге Баланце $ КСНУМКСБ -11.56% (5Д)
Укупан износ УСДТ који се држи на адресама размене. УСДТ Екцханге Баланце $ КСНУМКСБ 100% (5Д)
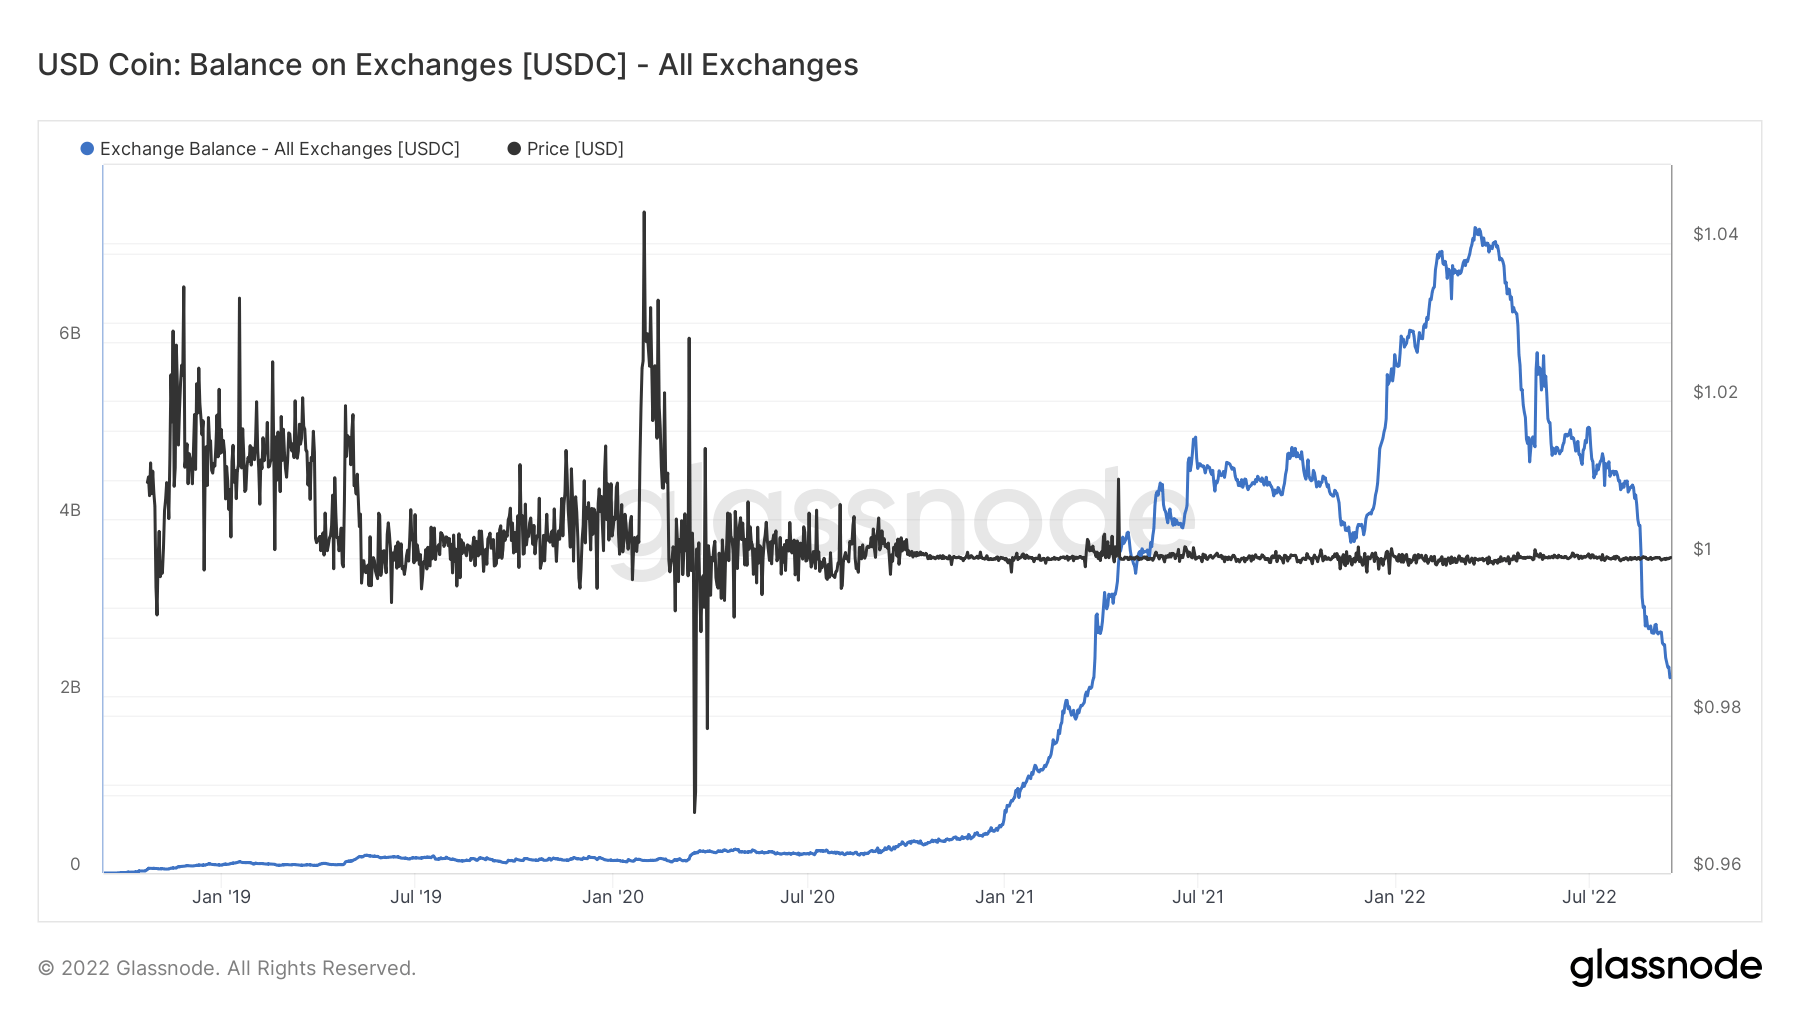
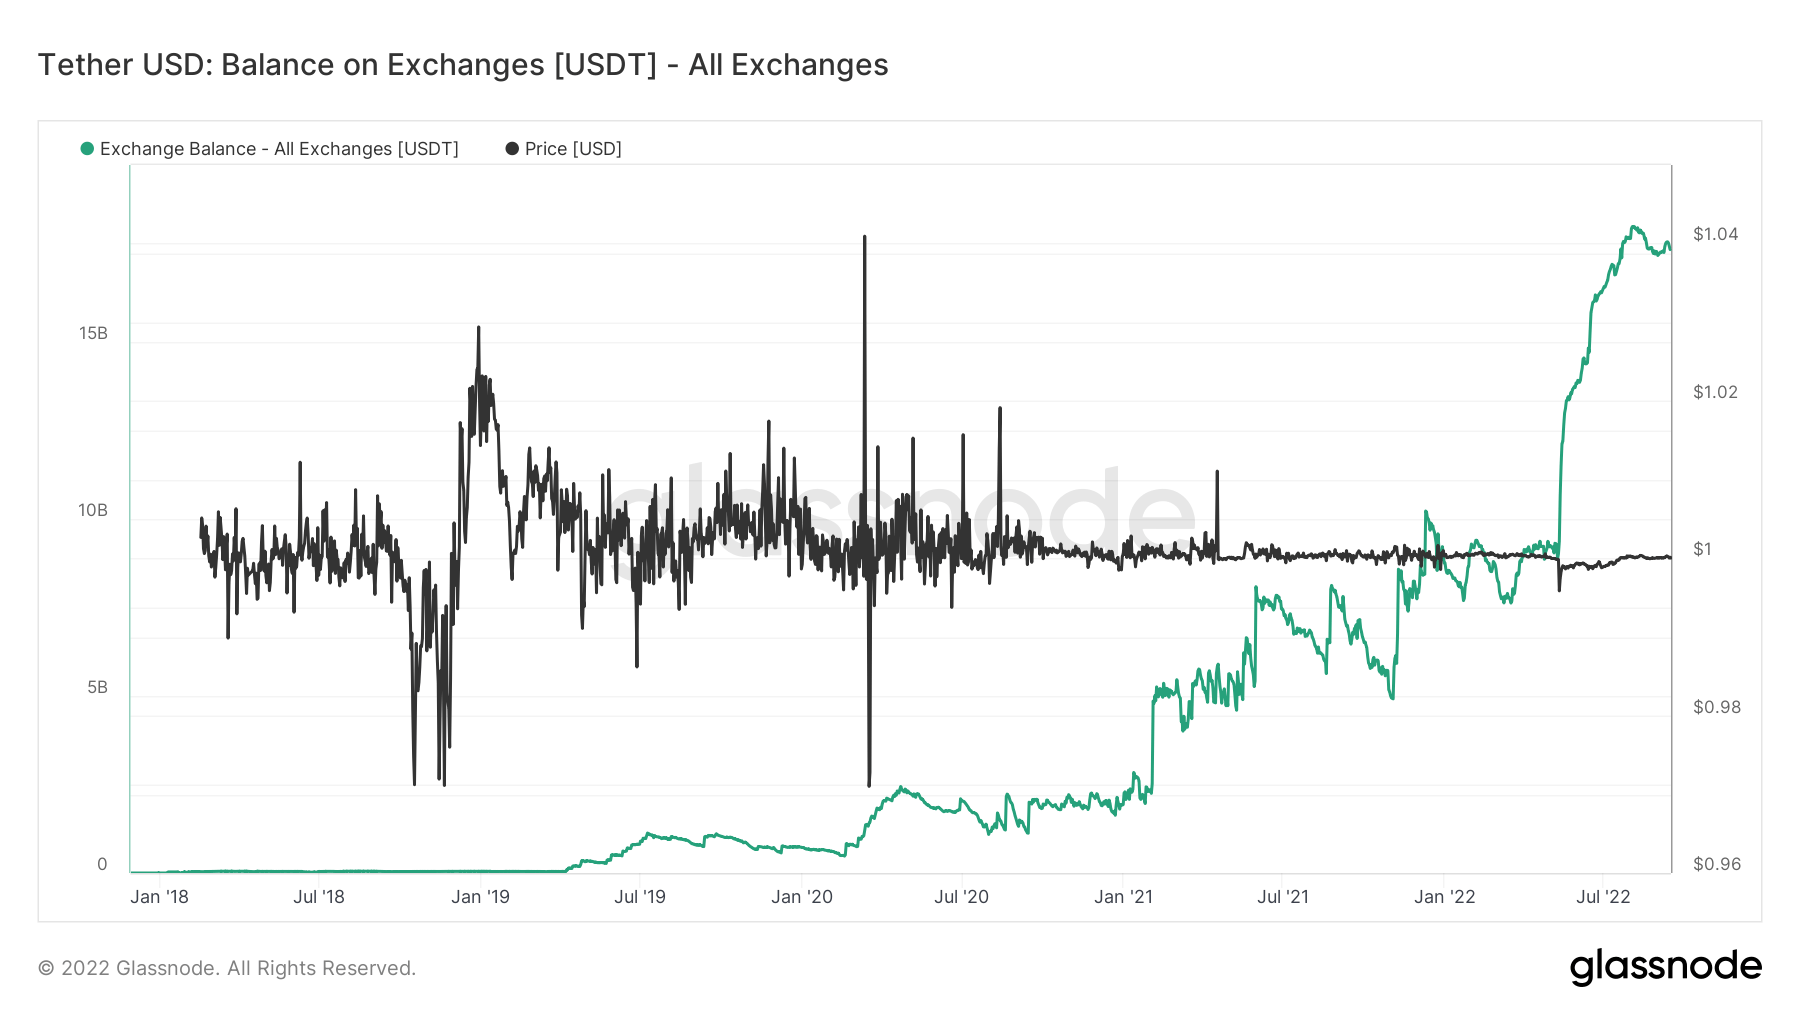
The divergence between USDC and USDT
“Dry powder” refers to the number of stablecoins available on exchanges held by investors who have acquired tokens such as USDC or USDT. The general assumption is high levels of stablecoins held on sales are a bullish sign for BTC as it shows a willingness to keep capital in the crypto markets until conditions change.
Significant divergence with balance on exchanges is occurring between USDC and USDT. USDC has come under some scrutiny recently, as Binance suspended withdrawals of USDC. A considerable amount of outflows occurred in 2022, just as USDC peaked in January with around $7 billion worth of stablecoins on exchanges.
However, USDT has only gone from strength to strength and has surpassed over $17 billion worth of stables on exchanges. Considering the amount of negative press USDT has received, it is still clearly the number one stablecoin for the time being.
Source: https://cryptoslate.com/market-reports/weekly-macroslate-a-hotter-than-expected-cpi-print-means-a-vicious-stagflationary-environment-awaits-bitcoin/