BeInCrypto takes a look at the price movement for seven different cryptocurrencies, including Terra (LUNA), which is very close to reaching a new all-time high price.
BTC
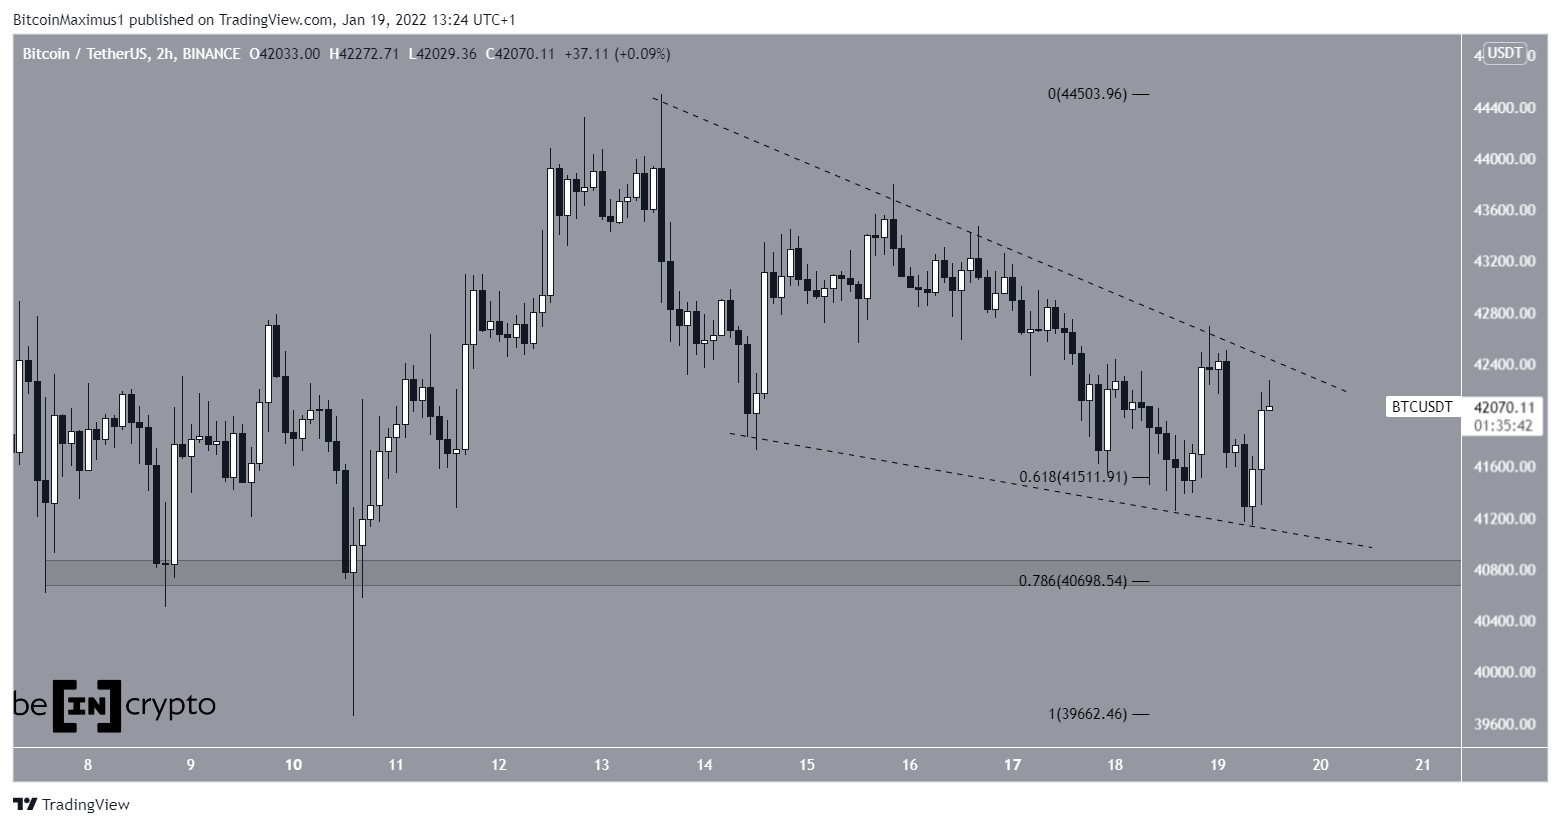
BTC has been trading inside a descending wedge since Jan 13. The wedge is considered a bullish pattern. This means that a breakout from it would be the most likely scenario.
So far, the price has bounced thrice at the support line of the wedge, most recently on Jan 19. The bounce transpired at the 0.618 Fib retracement support level at $41,500.
Furthermore, there is strong support at $40,700, created by the 0.786 Fib retracement support level. Therefore, a breakout from the pattern would be the most interesting scenario.

ETH
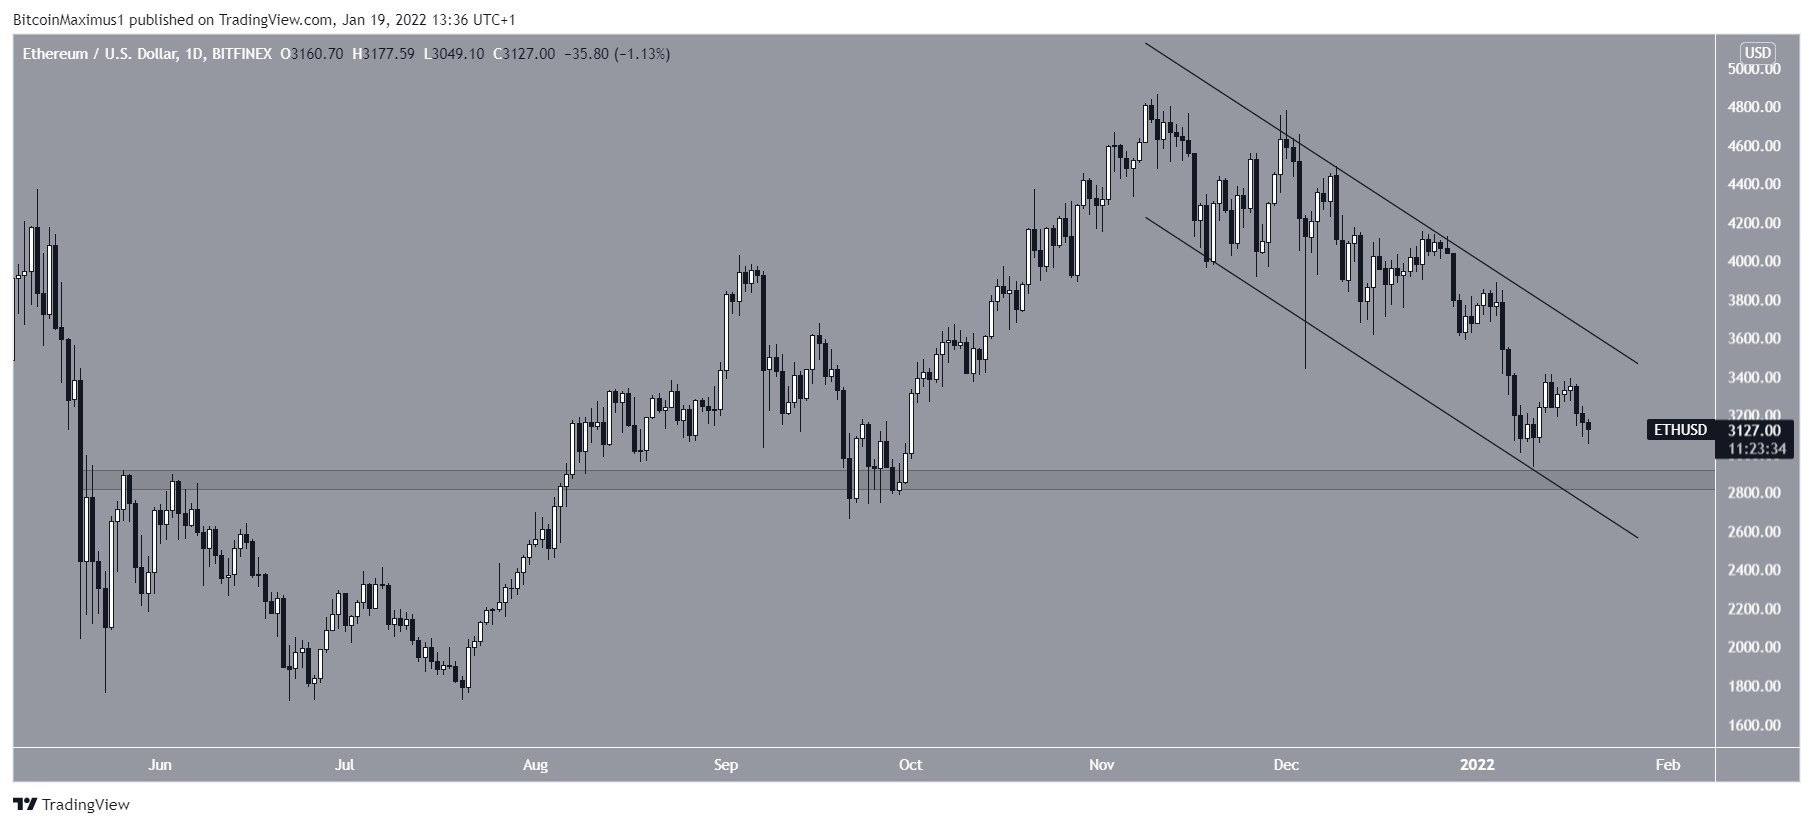
ETH has been falling since reaching an all-time high price on Nov 10. It is possible that the decrease has been contained inside a descending parallel channel, which is considered a corrective pattern. This would mean that an eventual breakout would be likely.
In addition to this, ETH is trading just above the $2,850 horizontal support area. This is a crucial area, since it has intermittently acted as both support and resistance since June 2021.


XRP
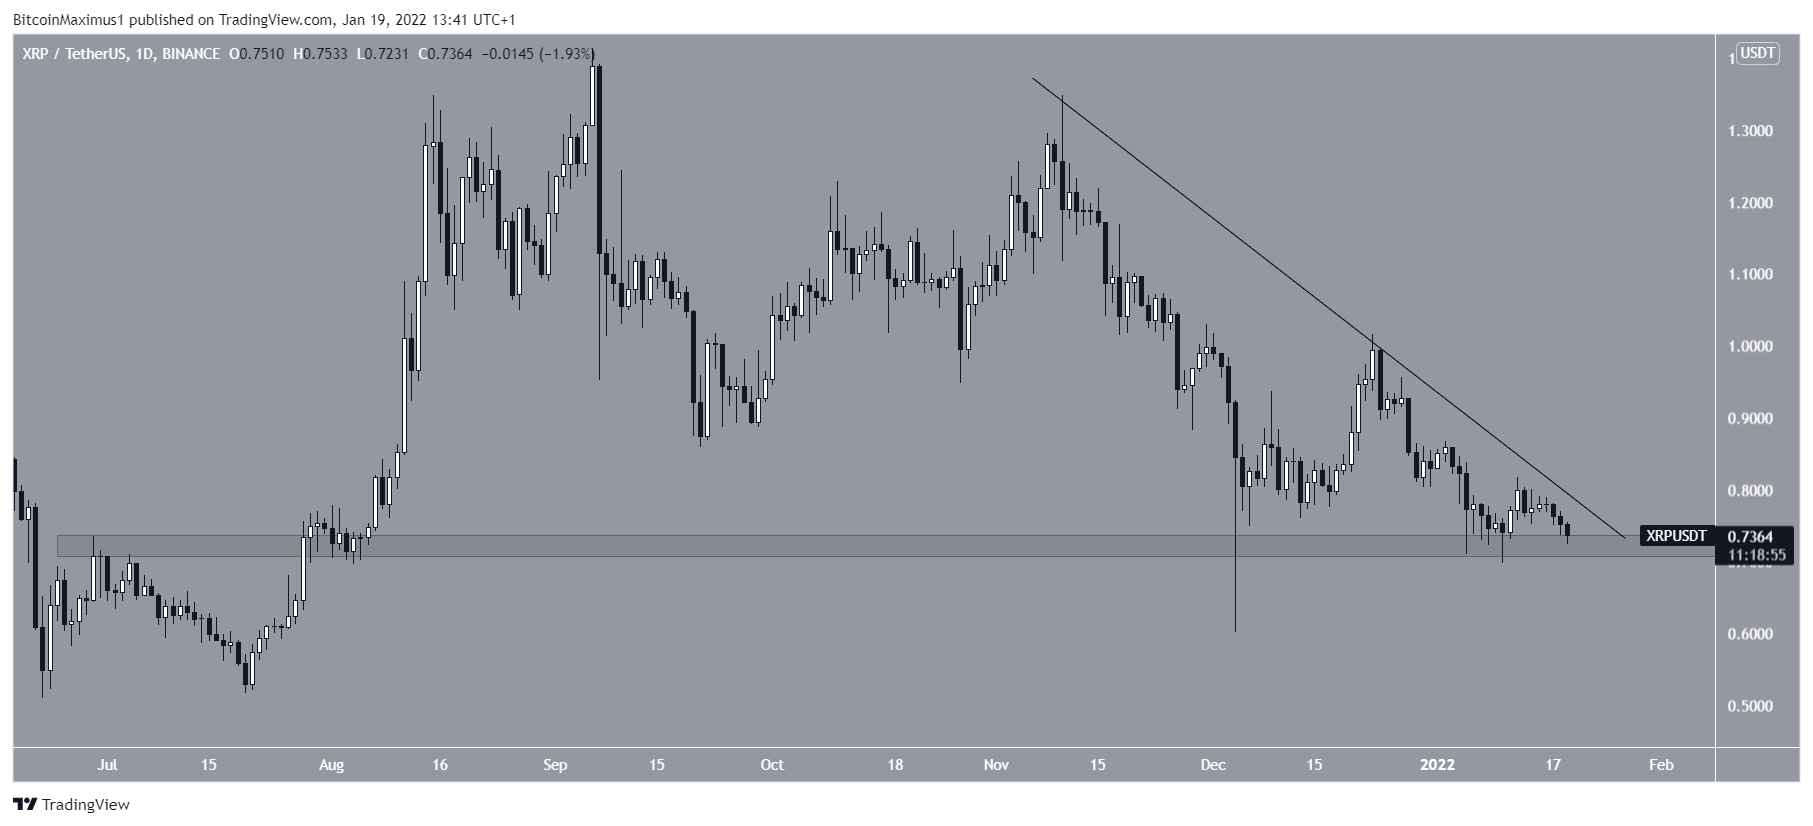
XRP has been falling alongside a descending resistance line since Nov 10. The downward movement led to a low of $0.60 on Dec 4.
Afterwards, the token bounced, but returned to the area once more on Jan 14.
Whether XRP breaks down below this area or breaks out from the descending resistance line will likely determine the direction of the future trend.
ATOM
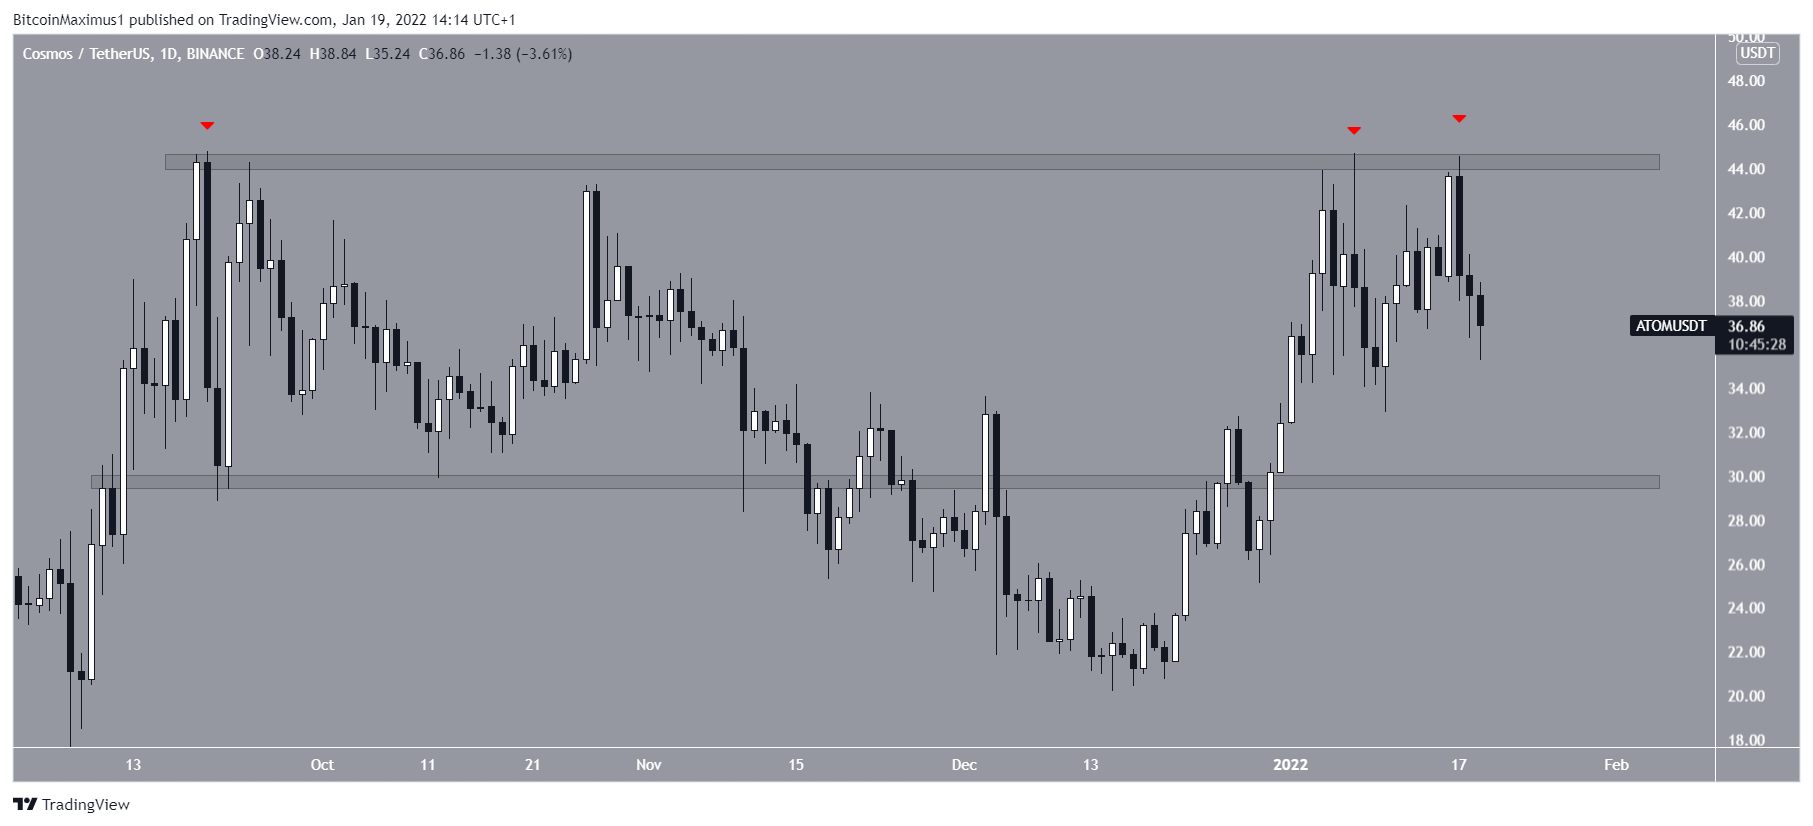
On Sept 20, ATOM reached a new all-time high price of $44.8. Afterwards, it began a correction which led to a low of $20.18 on Dec 15.
While the token attempted to reach a new all-time high, it failed to do so and was rejected by the $4 resistance area twice more in Jan. This created a triple top pattern relative to the all-time high.
If a downward movement transpires, the closest support area would be at $30.
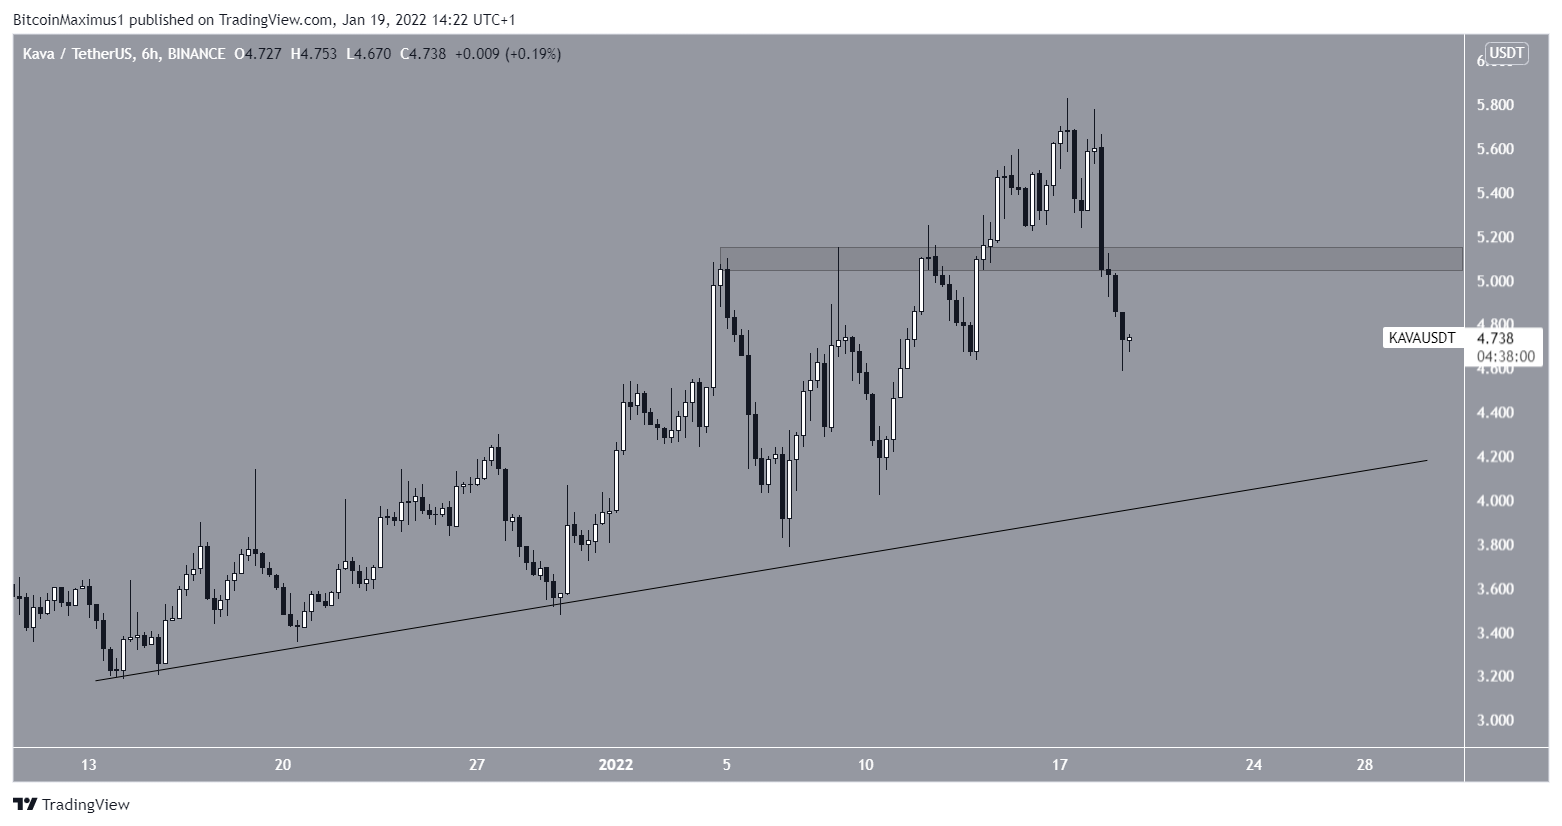
KAVA
KAVA has been increasing alongside an ascending support line since Jan 14. The upward movement led to a high of $5.82 on Jan 17.
However, the token failed to sustain its increase and fell above the $5.10 area afterwards. The area is now expected to act as resistance.
KAVA is currently in the process of decreasing towards the ascending support line at $4.20.

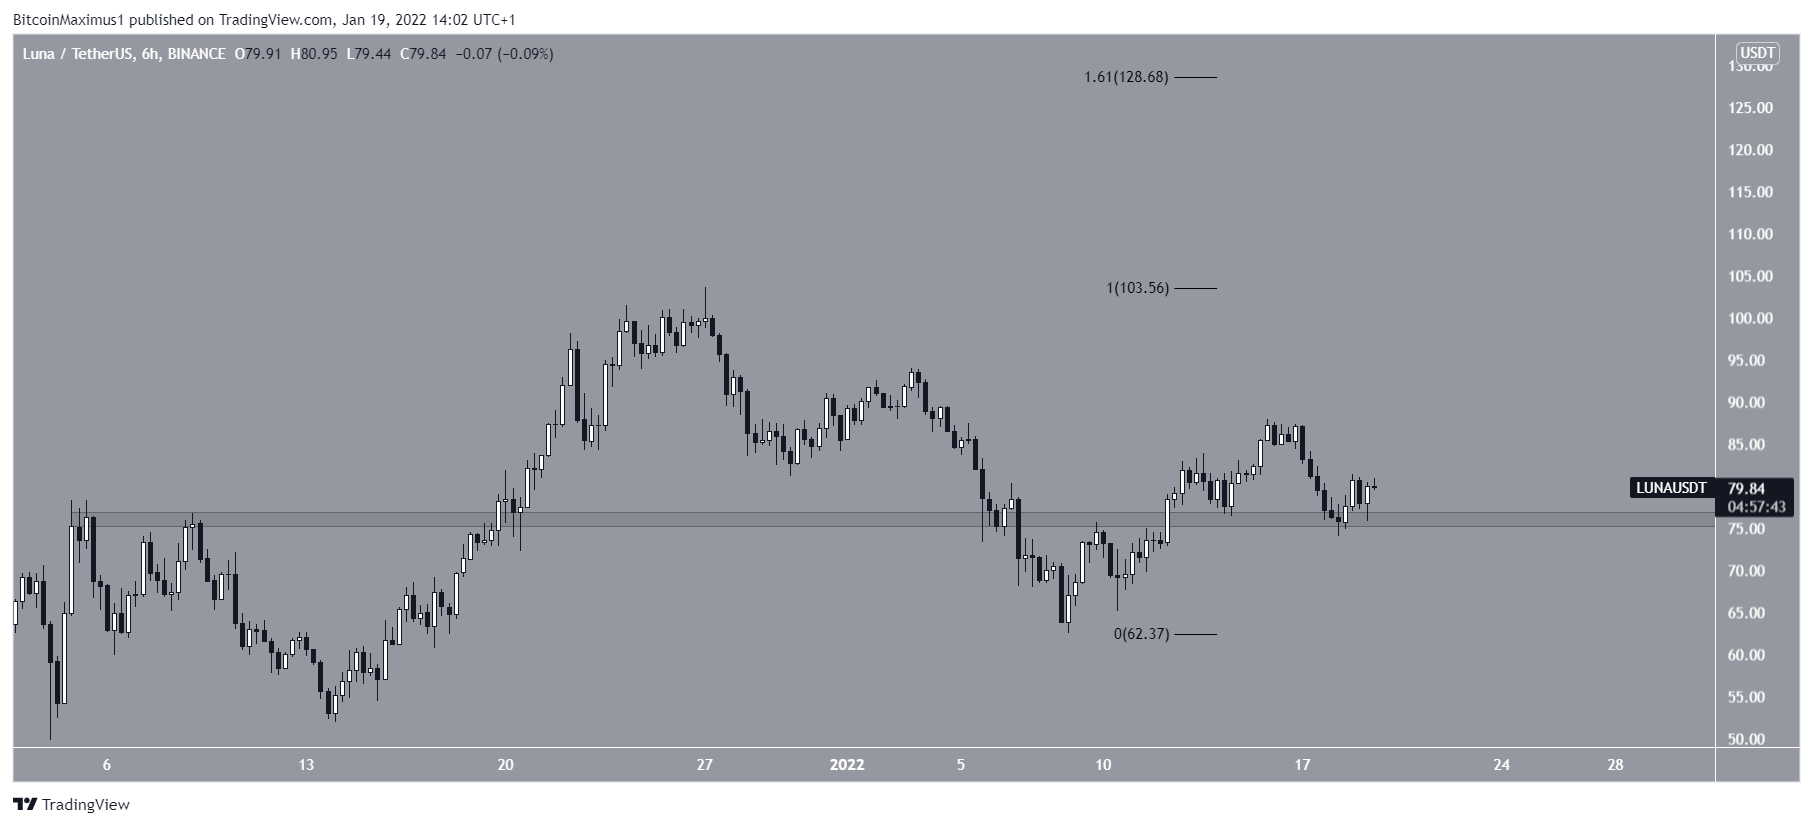
LUNA
LUNA has been falling since Dec 27, when it reached a new all-time high price of $103.6. The downward movement led to a low of $62.46 on Jan 8.
While it initially seemed that this caused a breakdown from the $75.5 area, LUNA initiated an upward movement shortly afterwards and reclaimed the area.
On Jan 18 (green icon), it validated it as support and began to move upwards.
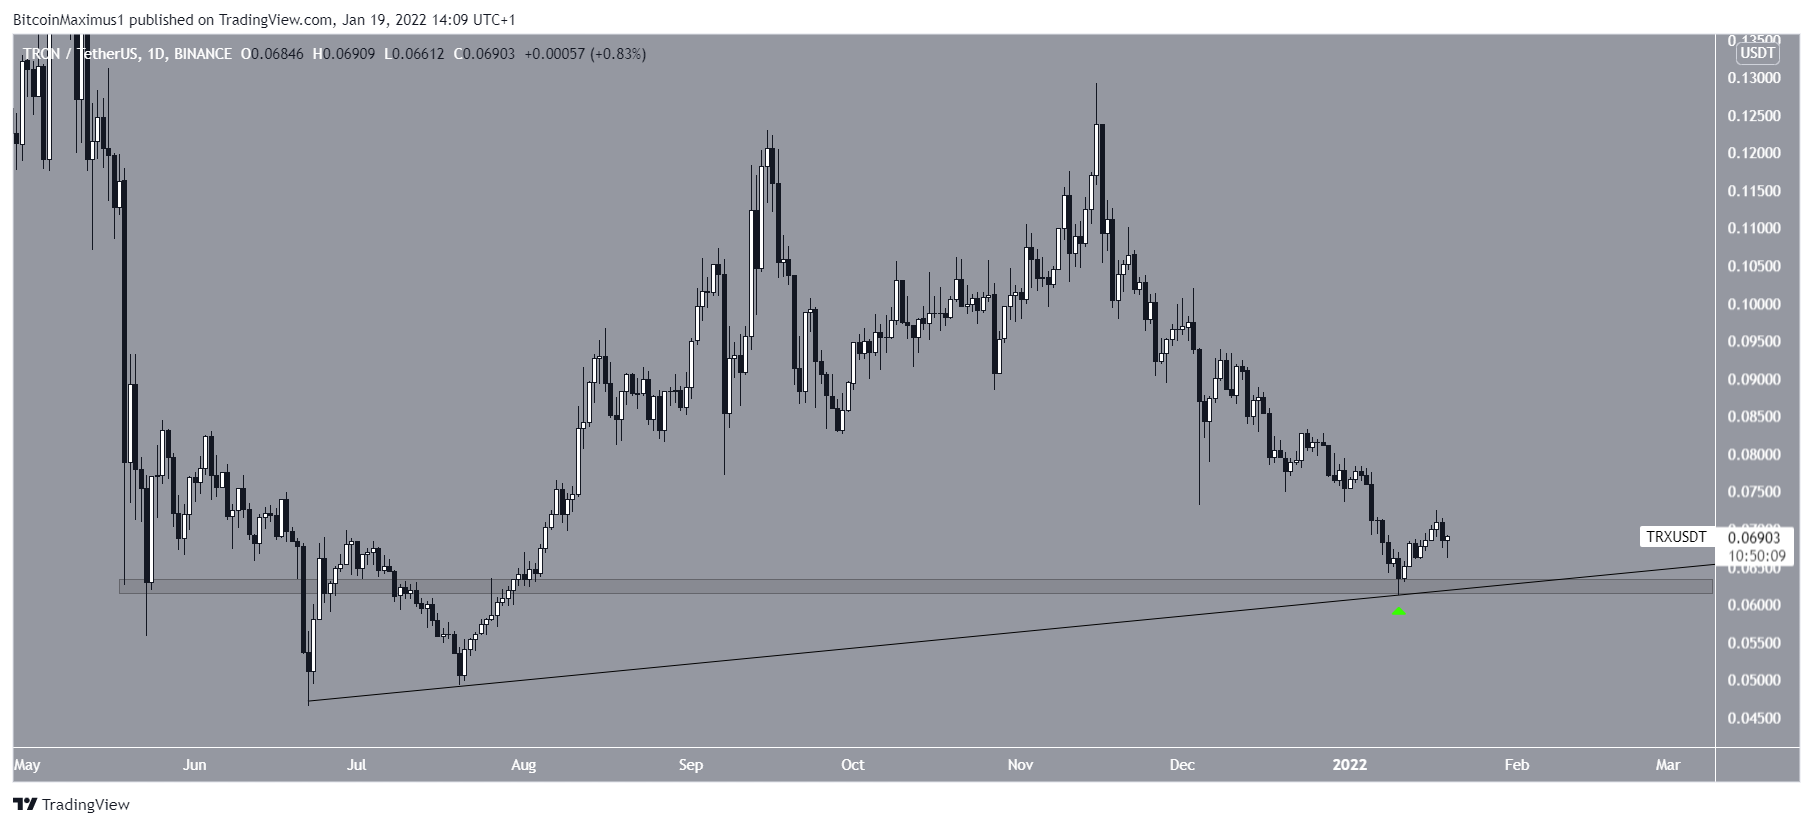
TRX
TRX has been falling since Nov 15, when it reached a high of $0.129. The downward movement led to a low of $0.06 on Jan 11. This served to validate both the $0.06 horizontal area and an ascending support line that has been in place since June.
As long as these support levels are in place, the bullish structure remains intact.
За најновију БеИнЦрипто анализу Битцоин (БТЦ), кликните овде.
Одрицање од одговорности
Све информације садржане на нашој веб страници објављују се у доброј намери и само у опште информације. Свака радња коју читалац предузме у вези са информацијама које се налазе на нашој веб локацији стриктно је на сопствени ризик.
Source: https://beincrypto.com/terra-luna-approaches-all-time-high-despite-market-correction/