Ethereum’s price has printed a substantial increase and finally surpassed the channel’s upper boundary. In spite of this, the cryptocurrency is approaching a critical resistance zone, and if a breakout occurs, an impulsive uptrend would become more likely.
Техничка анализа
By Схаиан
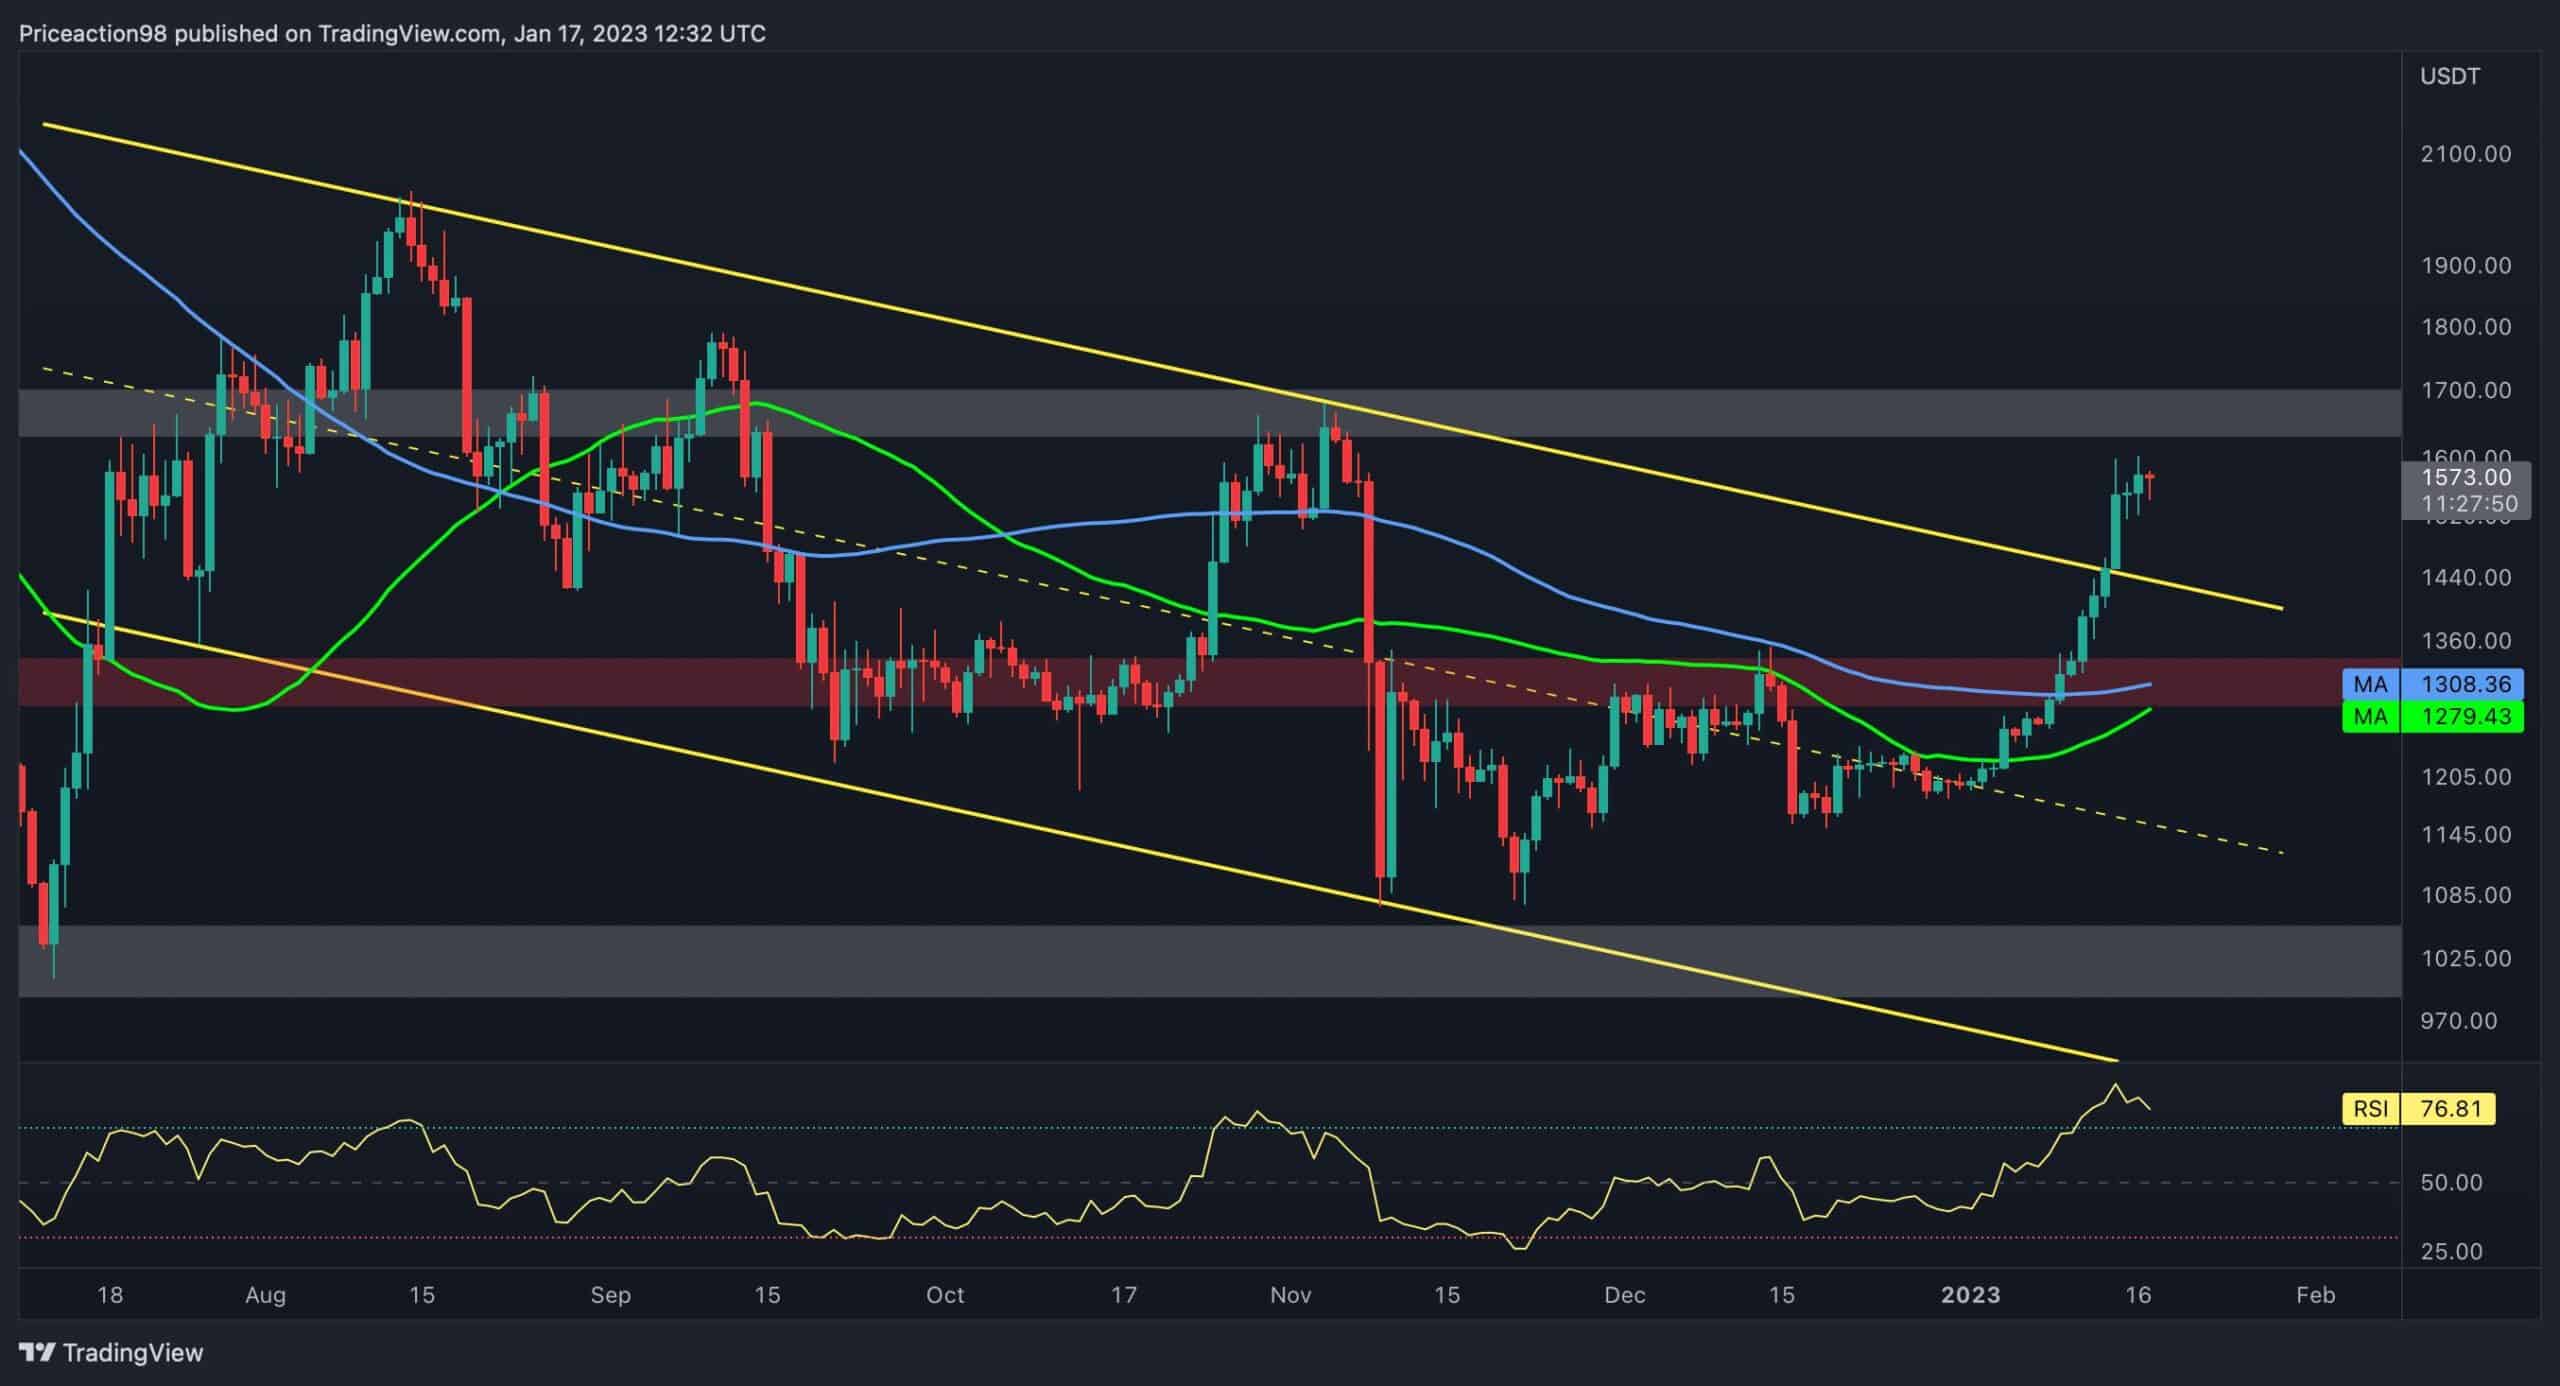
Дневни графикон
Ethereum’s price has experienced an uptrend since breaking above the 50 and 100-day moving average lines and has currently reached the $1.6K critical resistance zone.
This price region consists of two crucial resistance levels; the $1.6K static resistance level, which has been serving as a robust barrier to the price for the last couple of months, and the price’s prior major high at $1680, which typically serves as resistance in an uptrend.
Overall, pushing the price above this vital resistance level could be quite a challenge, and if successful, the market could potentially explode.

However, considering the price entering the overbought zone of the RSI indicator, a short-term consolidation could be possible before the next impulsive move.
4-сатни графикон
In the 4-hour timeframe, the price has been forming higher highs and higher lows which is a typical bullish sign. However, the cryptocurrency has simultaneously entered a short-term consolidation and reached the $1.6K resistance level.
Ethereum seems to have gained sufficient momentum to surpass the $1.6K resistance zone. Still, the existing bearish divergence between the price and the RSI indicator might halt the current uptrend for the short term and result in a correction phase with low volatility.

Он-Цхаин Аналисис
Би: Едрис
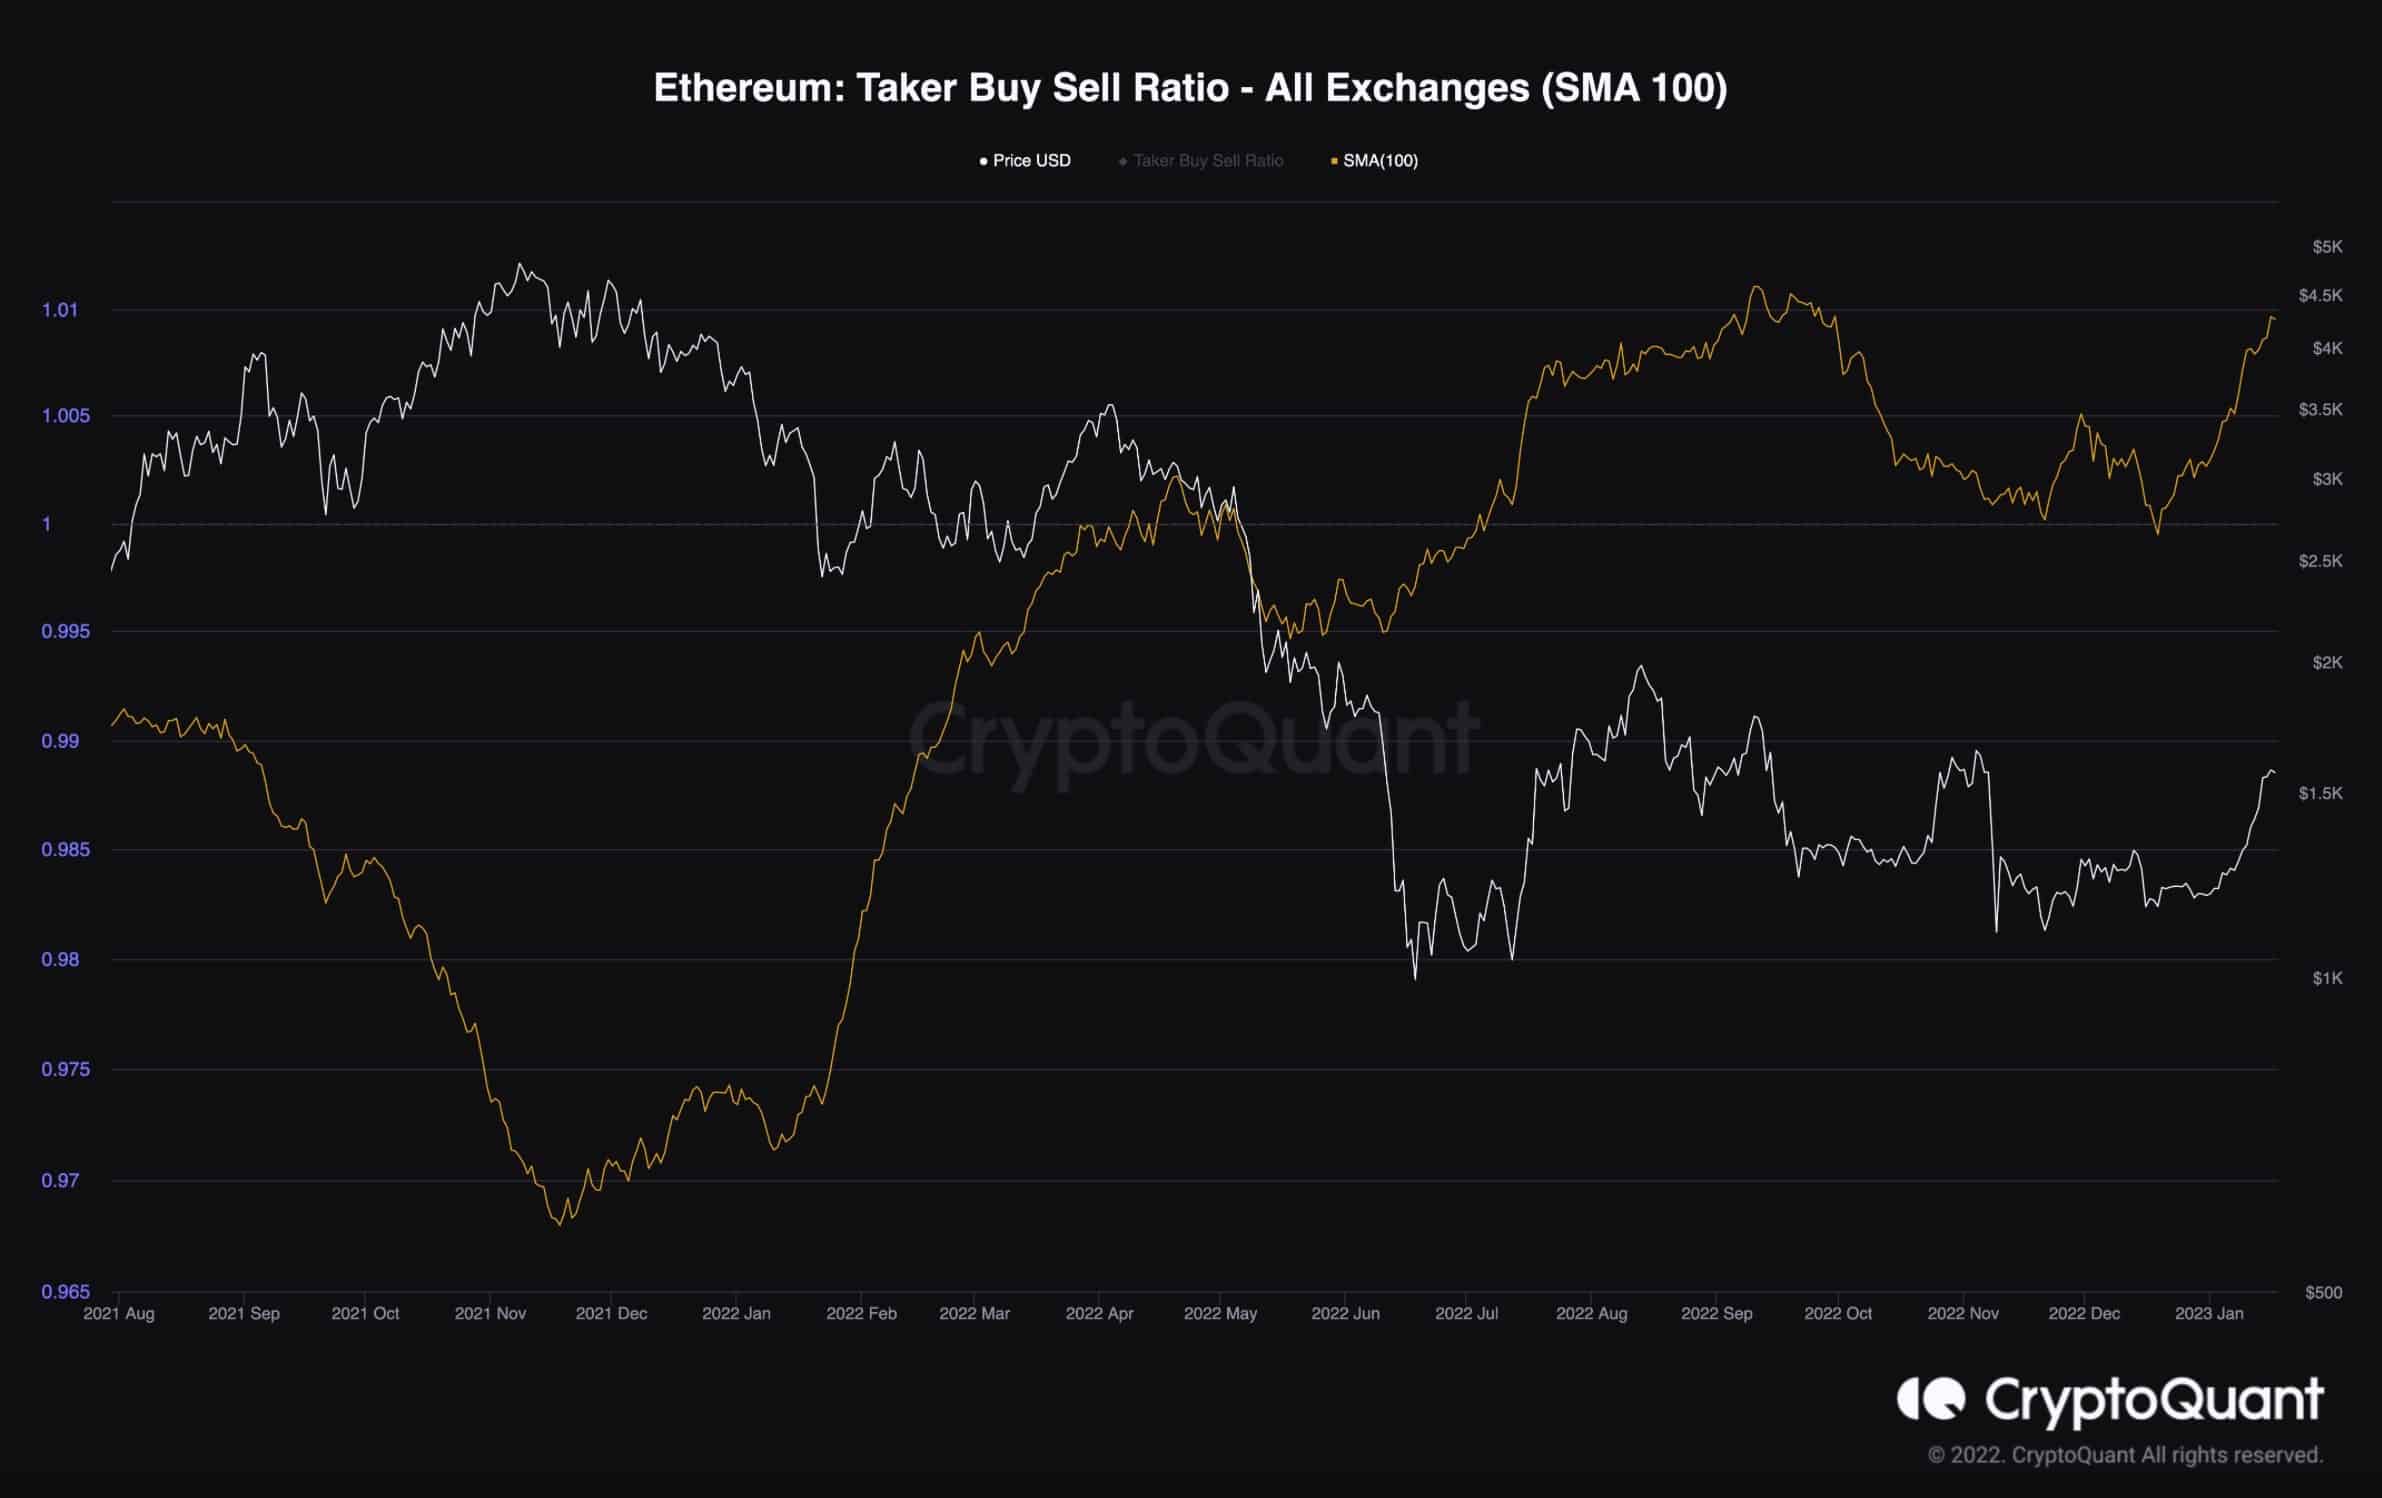
Етхереум Такер однос куповине и продаје (СМА 100)
Ethereum’s price has been significantly affected by the futures market over the last couple of years.
This chart represents the Taker Buy Sell Ratio with a 100-day standard moving average applied. This ratio demonstrates whether the bulls or the bears are executing their trades more aggressively, with values above 1 indicating bullish and below 1 showing bearish sentiment.
This metric has been rising for the last few weeks, indicating a positive shift in the futures market sentiment, followed by a price surge recently.
While the metric is currently above 1 and is trending higher, a reversal in its trend likely points to the possibility of a bearish reversal and should be monitored closely in the short term.
Бинанце бесплатно $100 (ексклузивно): Користите ову везу да се региструјете и добијете 100 $ бесплатно и 10% попуста на Бинанце Футурес првог месеца (услови).
ПримеКСБТ специјална понуда: Користите ову везу да се региструјете и унесете ПОТАТО50 код да бисте добили до 7,000 долара на своје депозите.
Изјава о одрицању одговорности: Подаци који се налазе на ЦриптоПотато-у су подаци писаца. Не представља мишљење ЦриптоПотата о томе да ли куповати, продавати или задржати било каква улагања. Саветујемо вам да спроведете сопствено истраживање пре него што донесете било какве одлуке о инвестирању. Користите достављене информације на сопствени ризик. Погледајте одрицање за додатне информације.
Крипто валута од ТрадингВиев.
Source: https://cryptopotato.com/eth-consolidates-below-critical-1-6k-resistance-whats-next-ethereum-price-analysis/