Ethereum has spent the last four weeks on a bullish footing as the buyers managed to shoot the price up from around $1,000. The bears were waiting around the overhead resistance at $1,800. They have prevented further price increases twice thus far, so is it time for the bulls to rest?
Техничка анализа
Би: Сивкаст
Дневни графикон
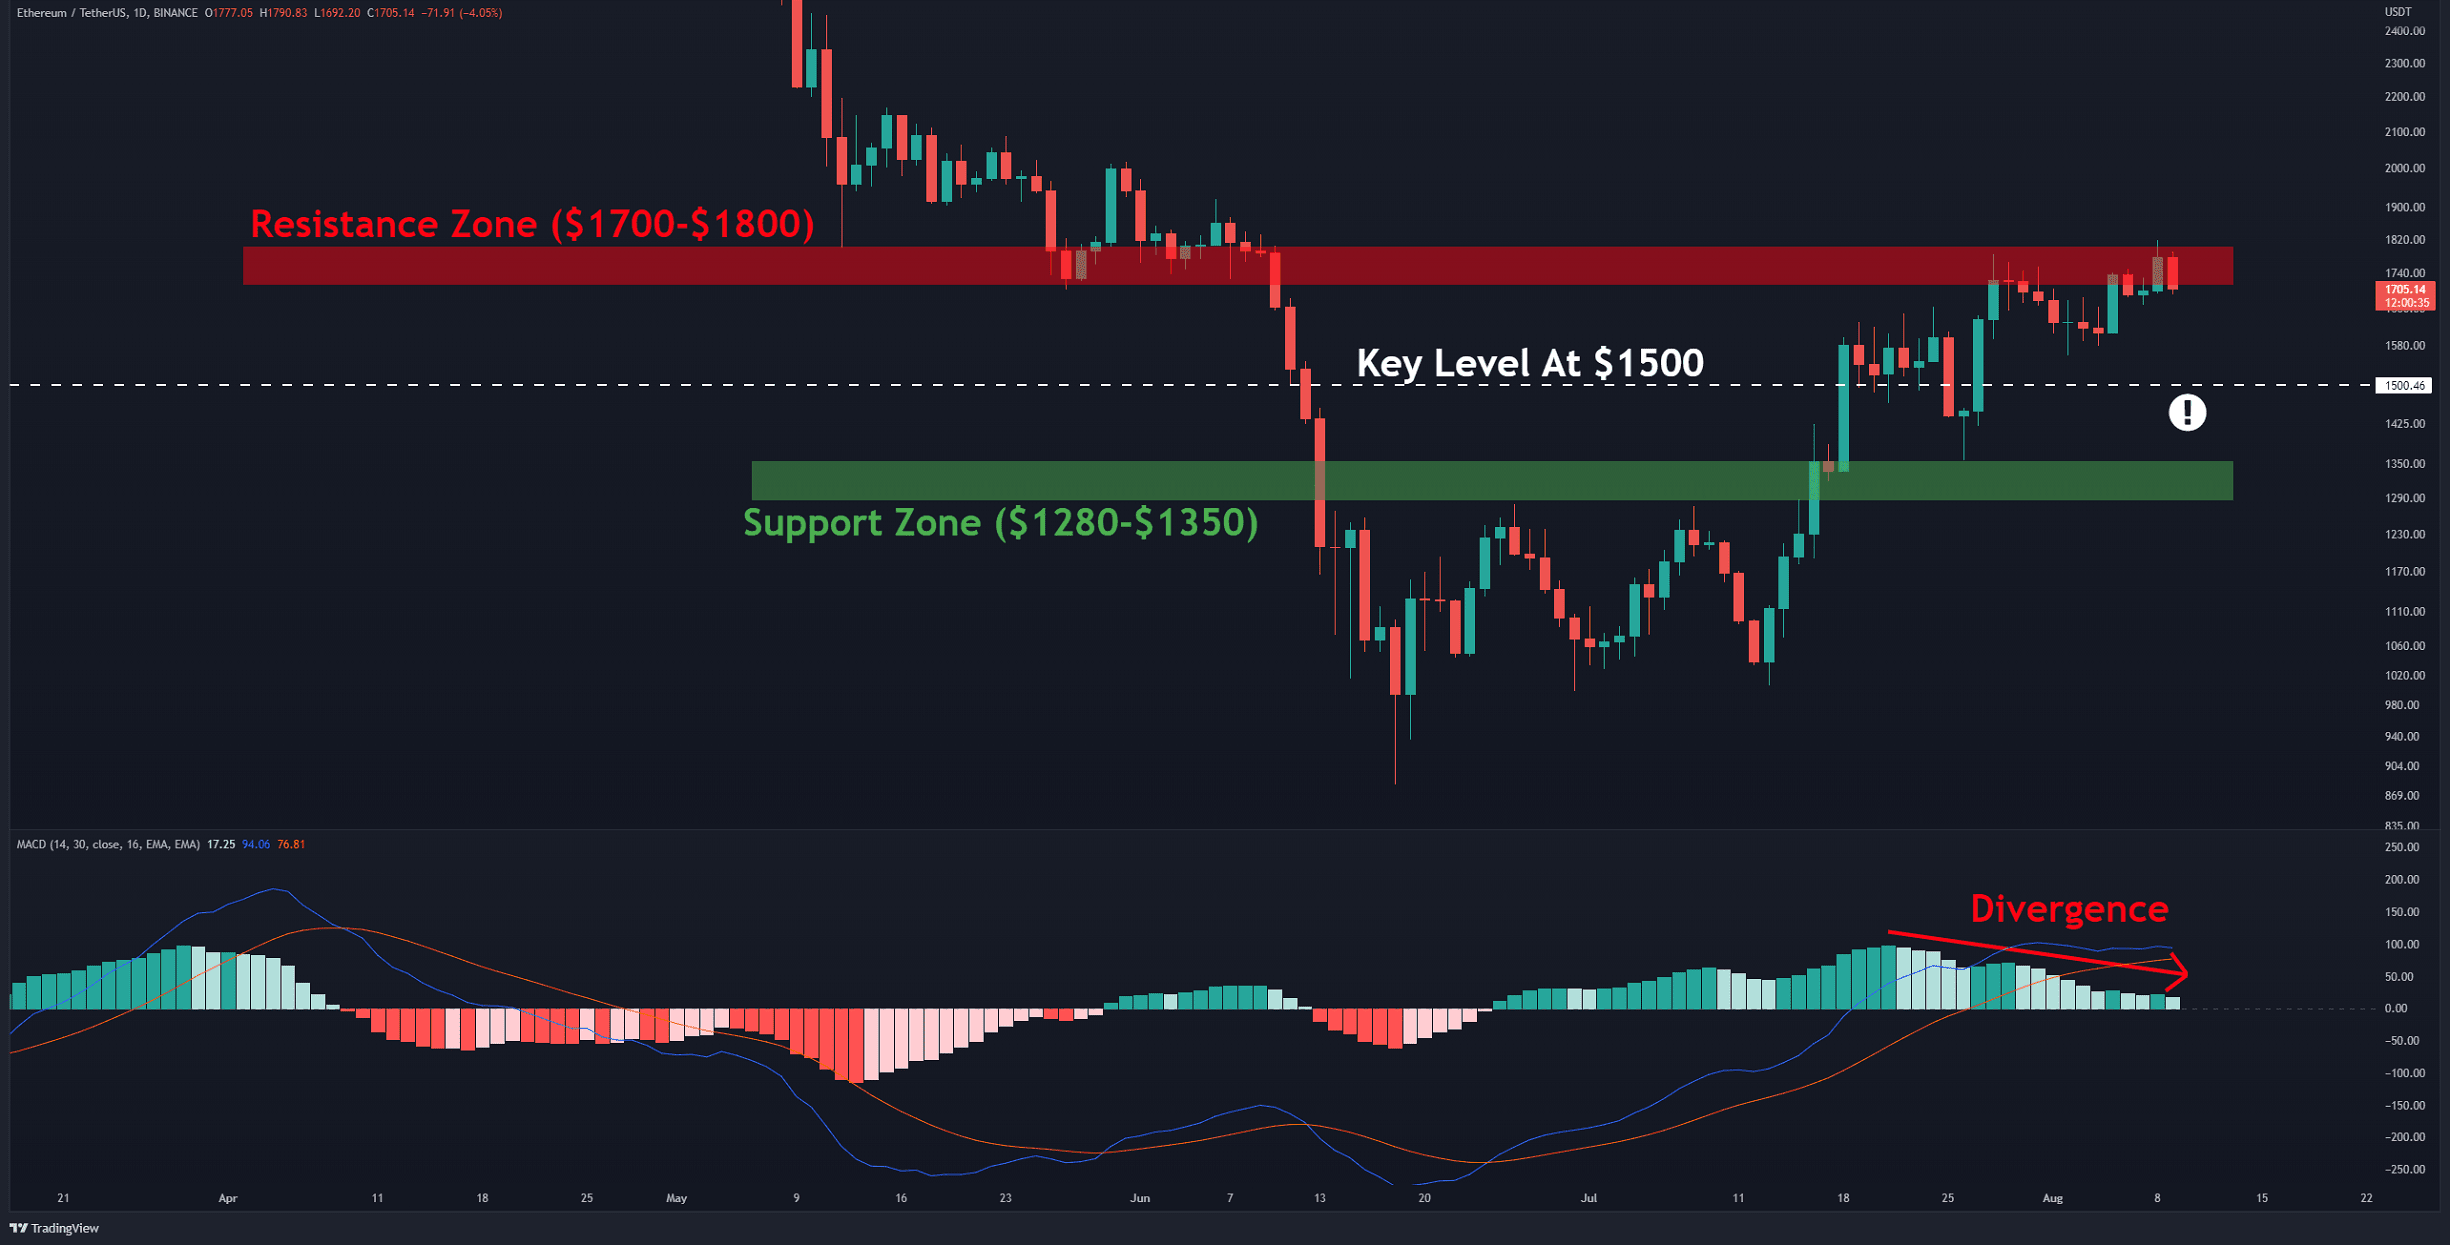
Yesterday, the bulls managed to briefly push the price above $1,800, but that’s where bears interfered. As a result, the cryptocurrency has fallen 6% as of this writing. The Moving Average Convergence Divergence (MACD) has shown negative divergence for some time, which is not good. Resuming the uptrend requires a break and close above the resistance zone at $1700-$1800 (in red).
On the other hand, if the bulls cannot clear this hurdle the bearish momentum may prompt the cryptocurrency to reach $1,500. A break below this level suggests that the bullish momentum has weakened. In this scenario, retesting the support zone in the range of $1,280-1,350 (in green) will look more likely.

Кључни нивои подршке: 1500 $ и 1350 $
Кључни нивои отпора: 1800 $ и 2160 $
Дневни покретни просеци:
МА20: 1635 долара
МА50: 1374 долара
МА100: 1636 долара
МА200: 2269 долара
ЕТХ/БТЦ графикон
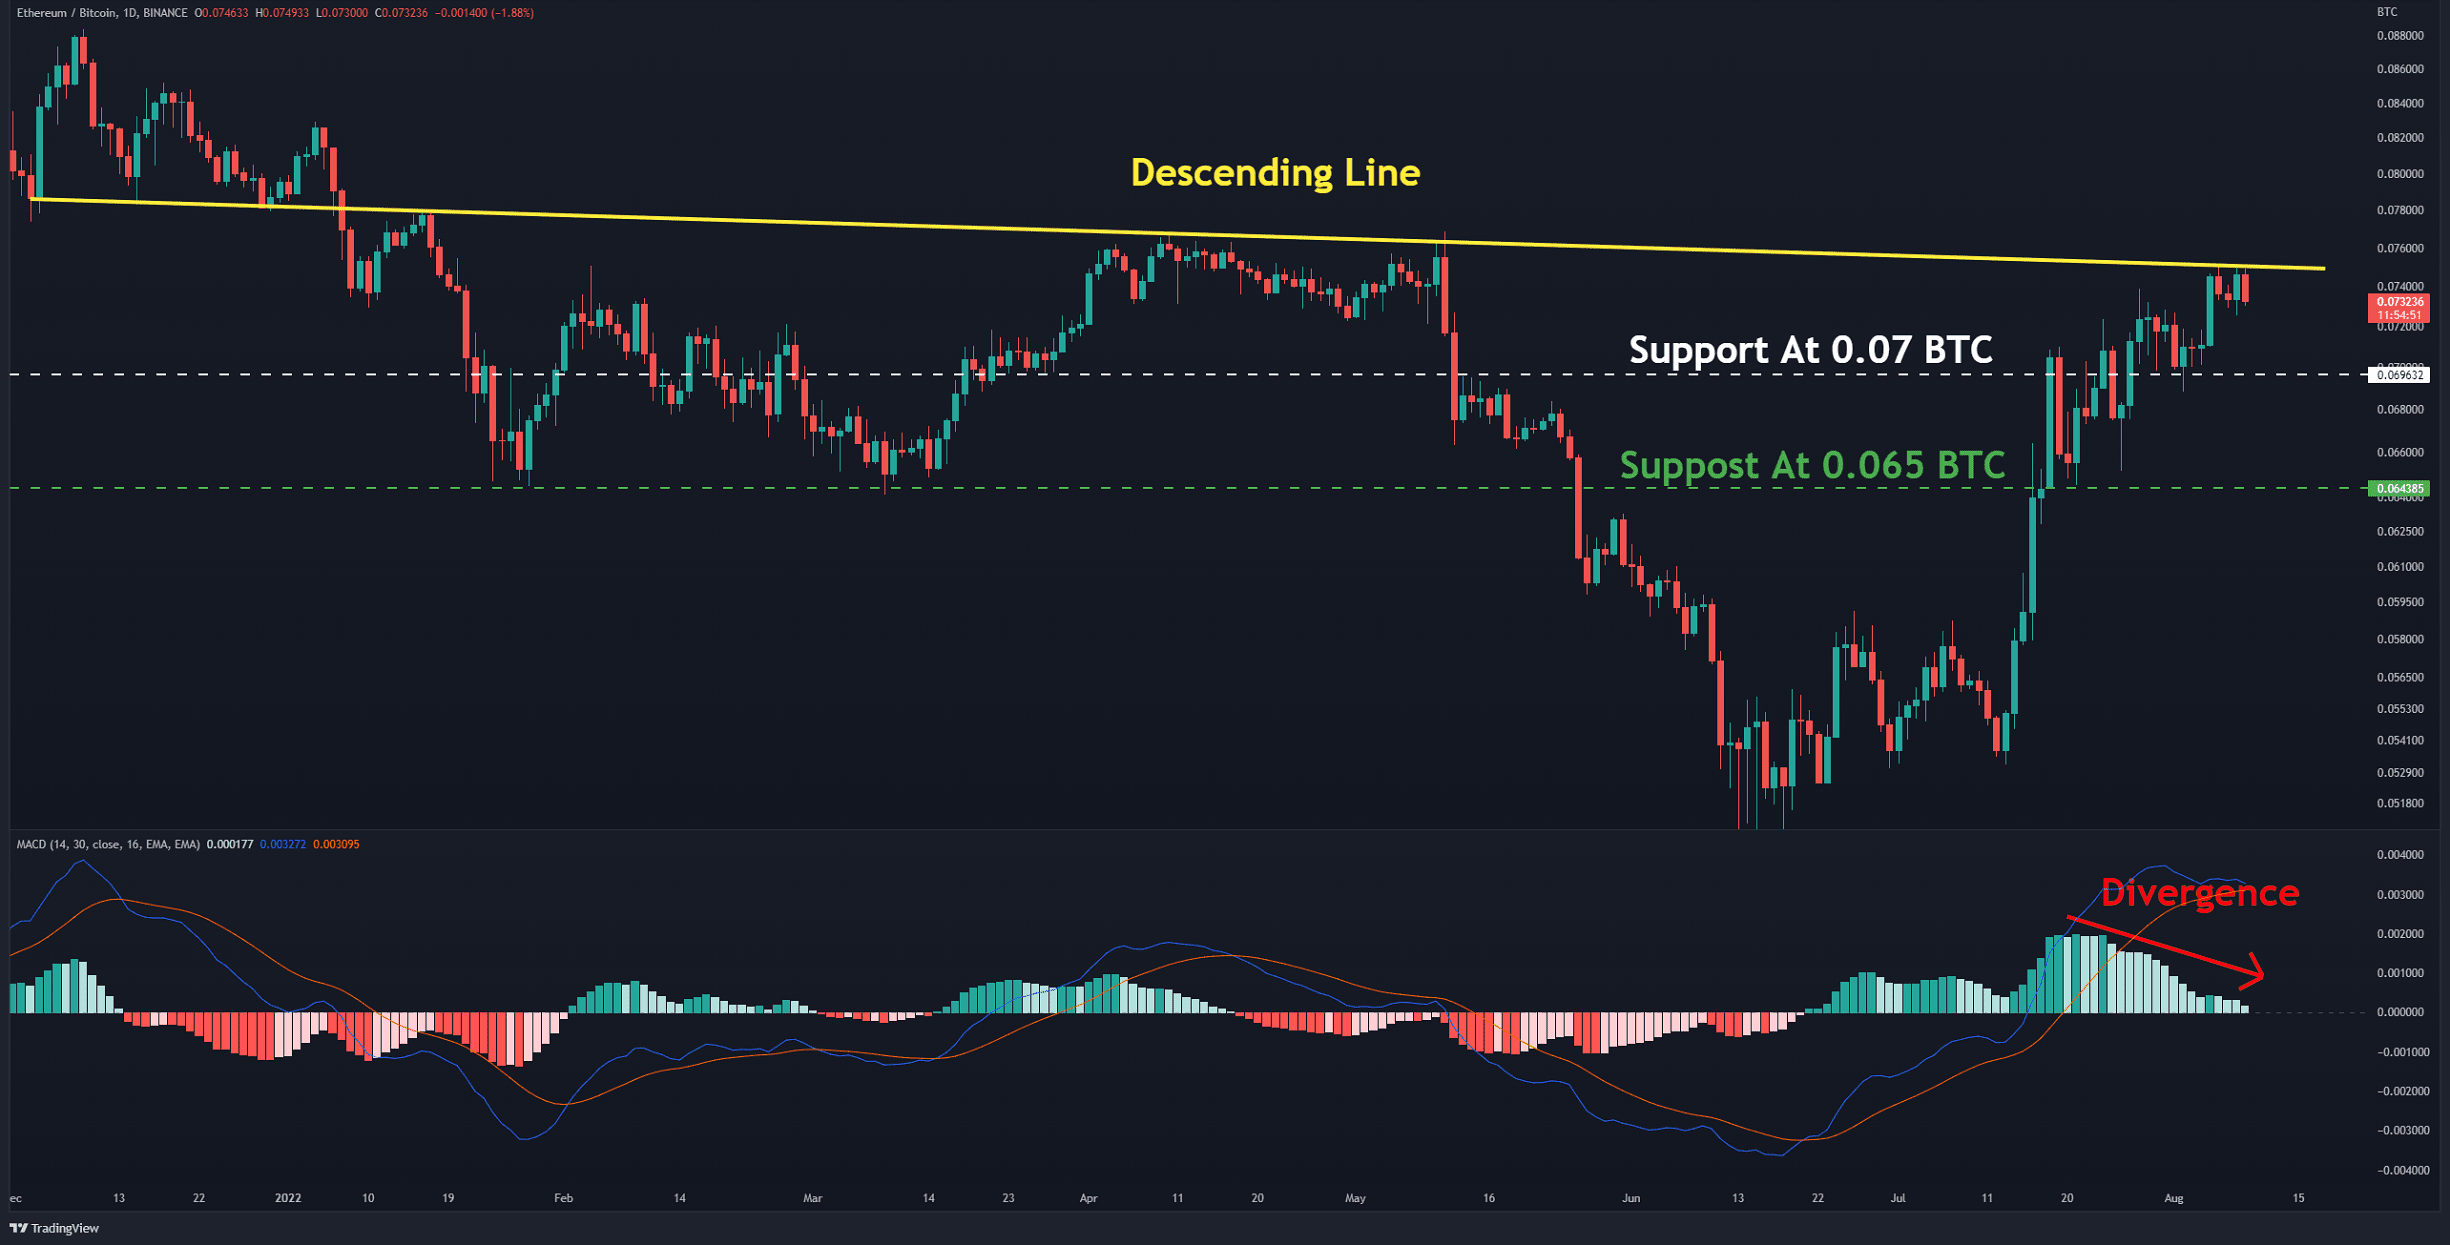
The bullish momentum against BTC seems to be waning. The divergence in the MACD indicator is clear. Bulls probably need to rest after breaking several firm resistances and reaching the descending line resistance (in yellow). The positive structure would remain strong as long as the bulls hold prices above 0.065 BTC (in green). If the horizontal support at 0.07 BTC (in white) cracks, the downtrend will likely be triggered. A close below 0.065 BTC signals the formation of a bearish structure.
Кључни нивои подршке: 0.07 & 0.065 БТЦ
Кључни нивои отпора: 0.075 & 0.08 БТЦ
Анализа на ланцу
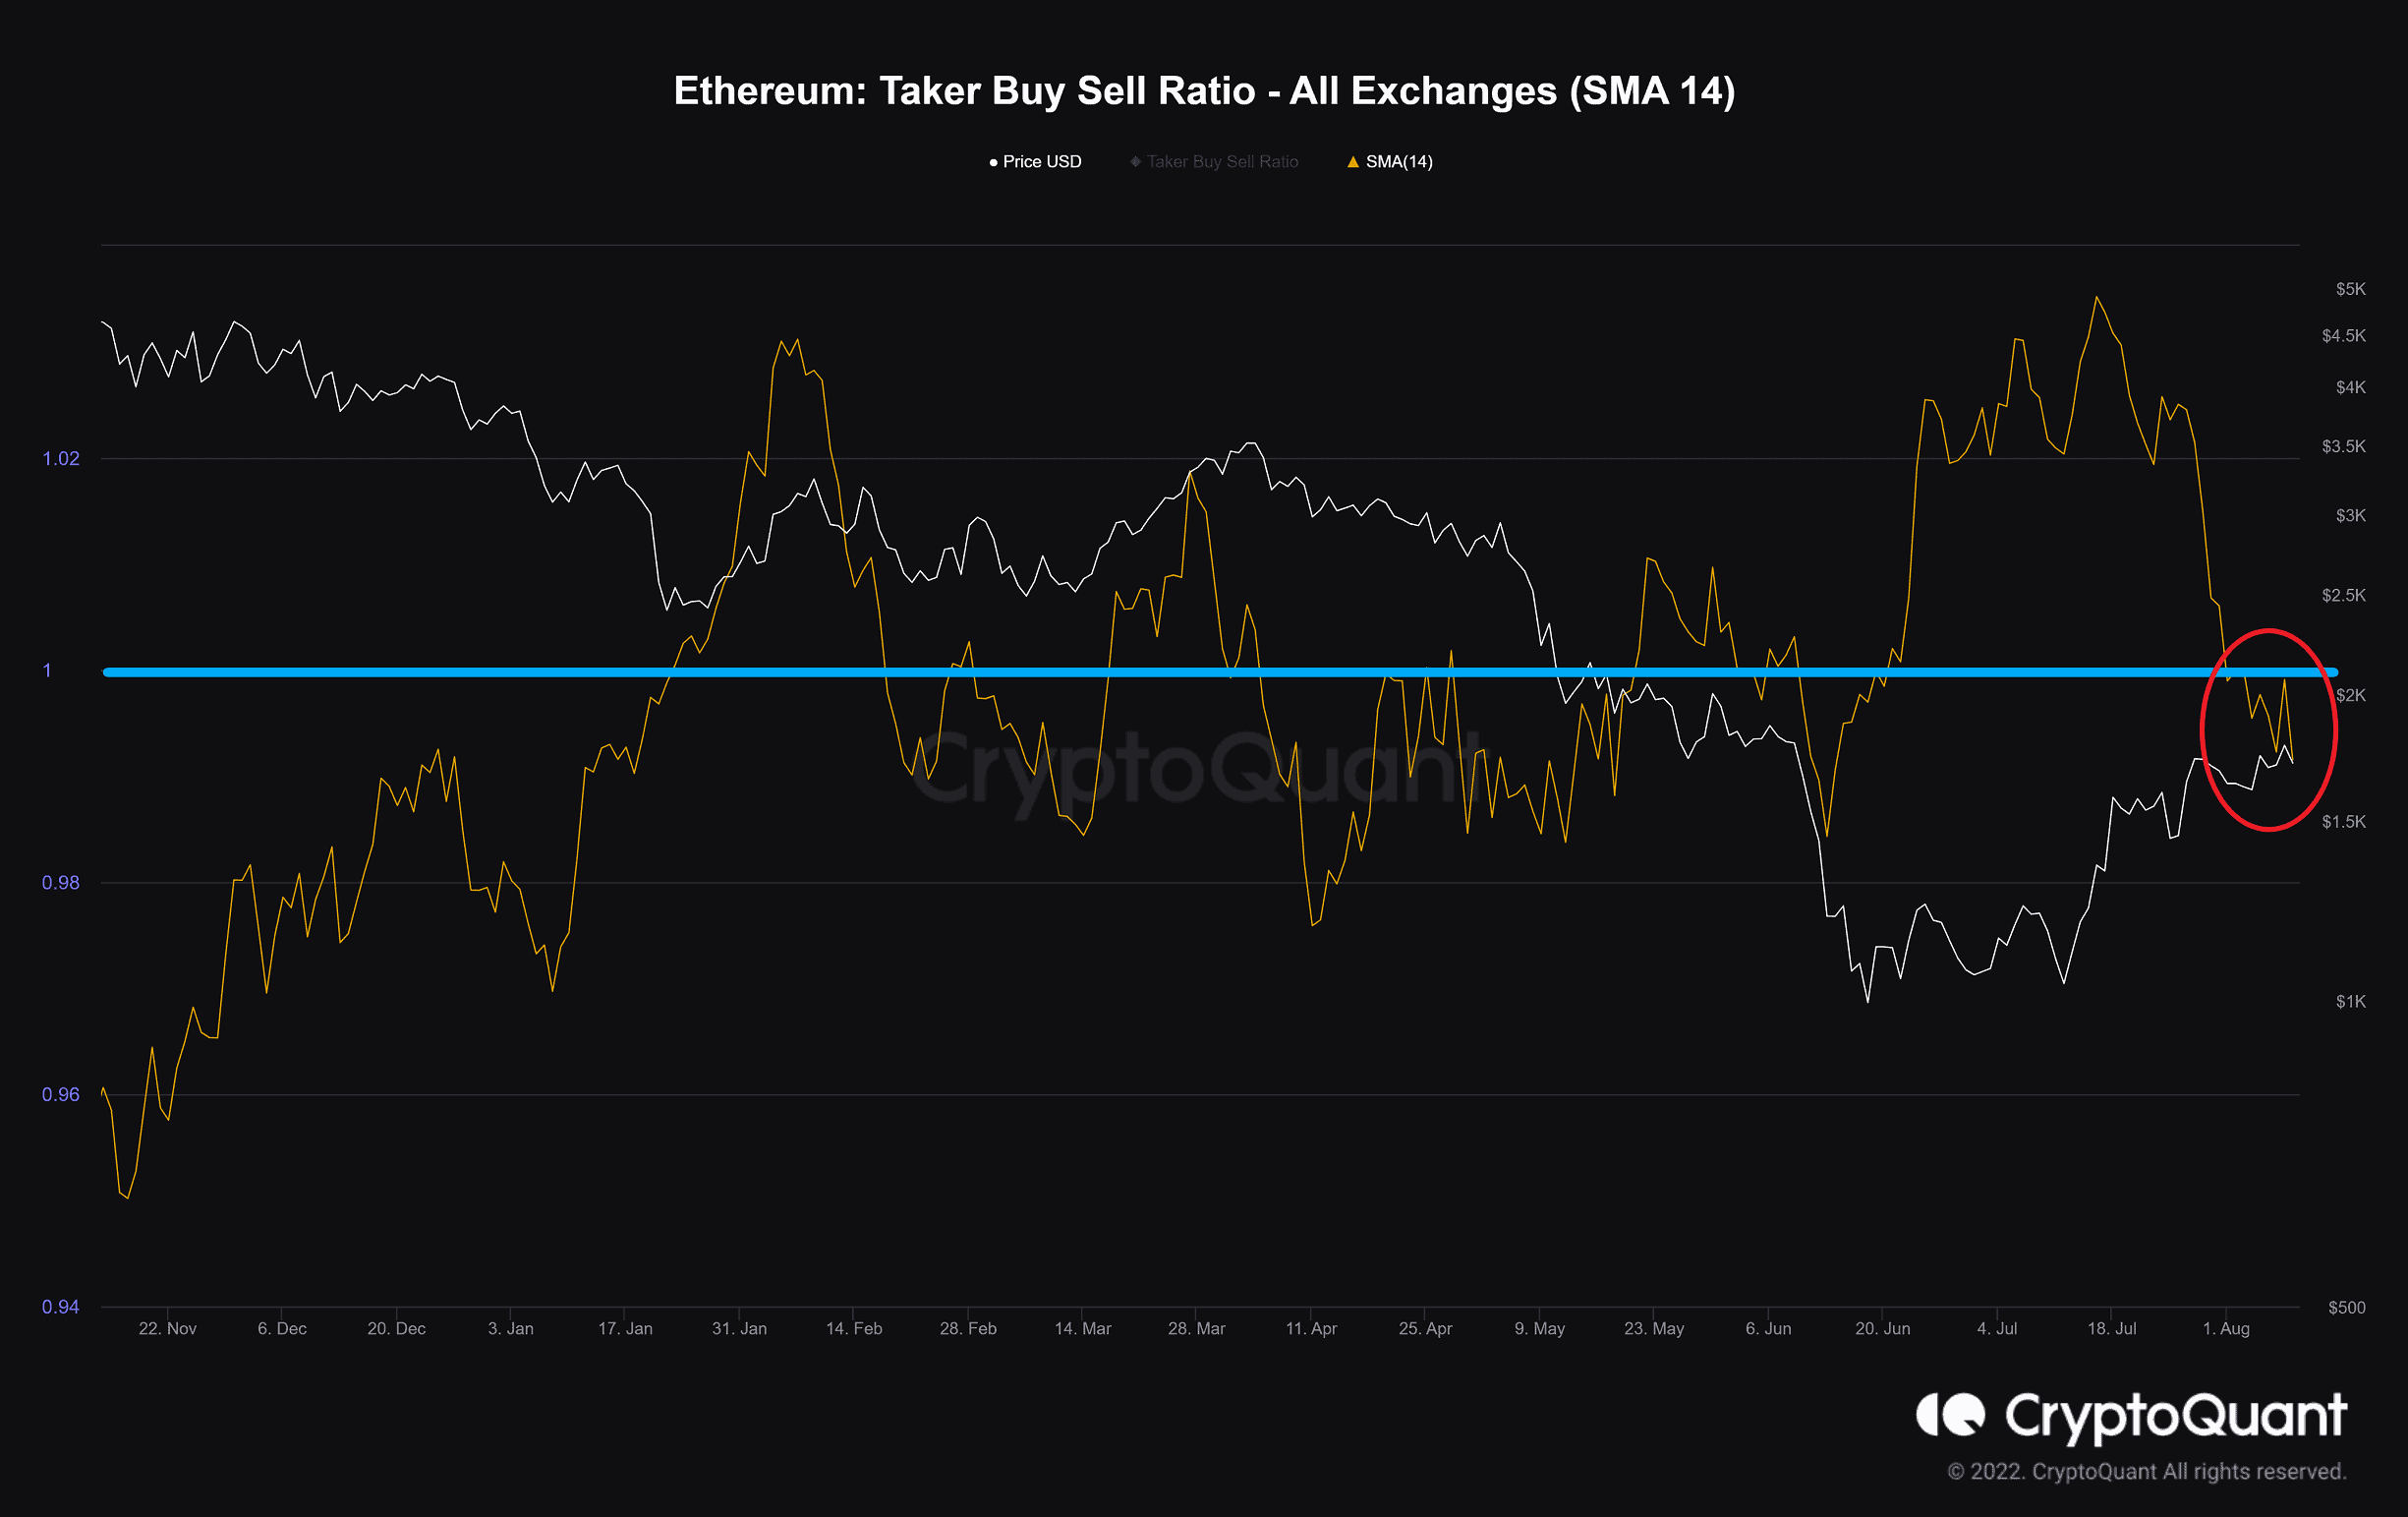
Такер Буи Селл Ратио
Дефиниција: The ratio of buy volume divided by sell volume of takers in perpetual swap trades.
Values over 1 indicate bullish sentiment is dominant.
Values under 1 indicate bearish sentiment is dominant.
According to CryptoQuant data, takers fill more sell orders in the derivatives market. This makes the bearish sentiment prevail for the time being. This metric ideally must stay below 1 (light blue line), so it’s important to remain very cautious.
Бинанце бесплатно $100 (ексклузивно): Користите ову везу да се региструјете и добијете 100 $ бесплатно и 10% попуста на Бинанце Футурес првог месеца (услови).
ПримеКСБТ специјална понуда: Користите ову везу да се региструјете и унесете ПОТАТО50 код да бисте добили до 7,000 долара на своје депозите.
Изјава о одрицању одговорности: Подаци који се налазе на ЦриптоПотато-у су подаци писаца. Не представља мишљење ЦриптоПотата о томе да ли куповати, продавати или задржати било каква улагања. Саветујемо вам да спроведете сопствено истраживање пре него што донесете било какве одлуке о инвестирању. Користите достављене информације на сопствени ризик. Погледајте одрицање за додатне информације.
Крипто валута од ТрадингВиев.
Source: https://cryptopotato.com/eth-corrects-6-overnight-after-failing-to-overcome-1-8k-ethereum-price-analysis/