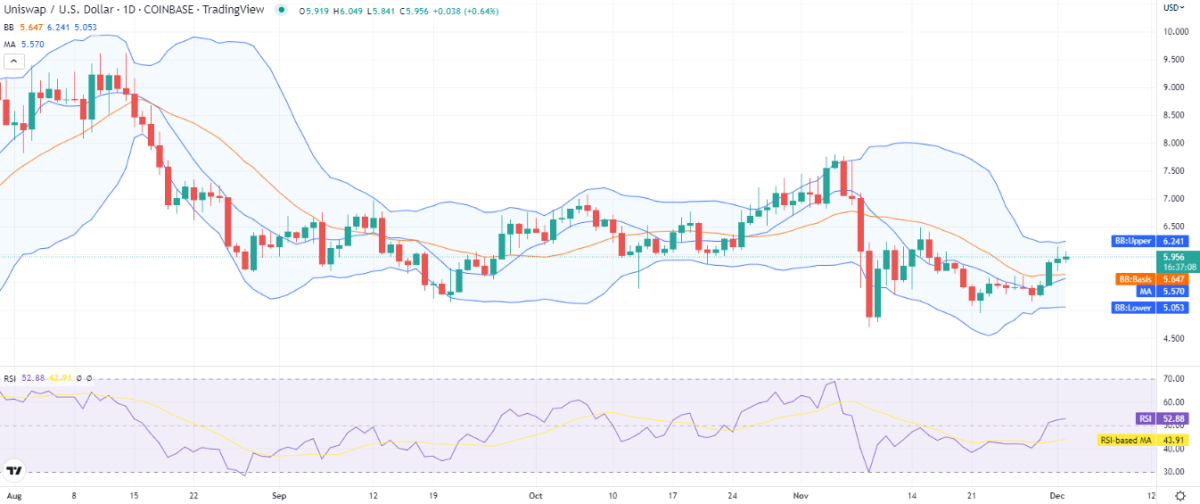
Унисвап цена analysis reveals UNI/USD is in bullish momentum. For the fourth day in a row, the price has been steadily increasing and is currently at the $5.95 mark. The cryptocurrency has gained a large amount of value thanks to the positive trend, as evidenced by the higher price movement. Resistance for the UNI/USD is present at $6.25; in contrast, support is solid at $5.83. However, the bears have been exerting some selling pressure over the past four hours, challenging the upward price function.
UNI/USD 1-day price chart: UNI gains 3.46 percent value more
A price increase is shown on the Uniswap price analysis 1-day price chart. At the time of writing, the price of the UNI/USD is $5.95. The cryptocurrency pair increased in value by $3.46 during the last day, and it has increased in value by 10.98% over the previous week. With a 13.68 percent growth in trading volume and a 3.41 percent gain in market capitalization, there is now 0.53 percent market domination.

The Bollinger bands are showing their highest limit at the $6.24 mark, which represents the resistance, while the lower band is present at the $5.05 mark, which represents the support for UNI/USD. This indicates a low level of volatility for UNI/USD The mean average line of the indicator is forming at $5.64 below the coin’s price.
The relative strength index (RSI), which has a very little upward slope, is trading at index 52 in the top half of the neutral zone. The indicator depicts a remarkably gradual increase in purchase activity.
Анализа Унисвап цена: Недавна дешавања и даље техничке индикације
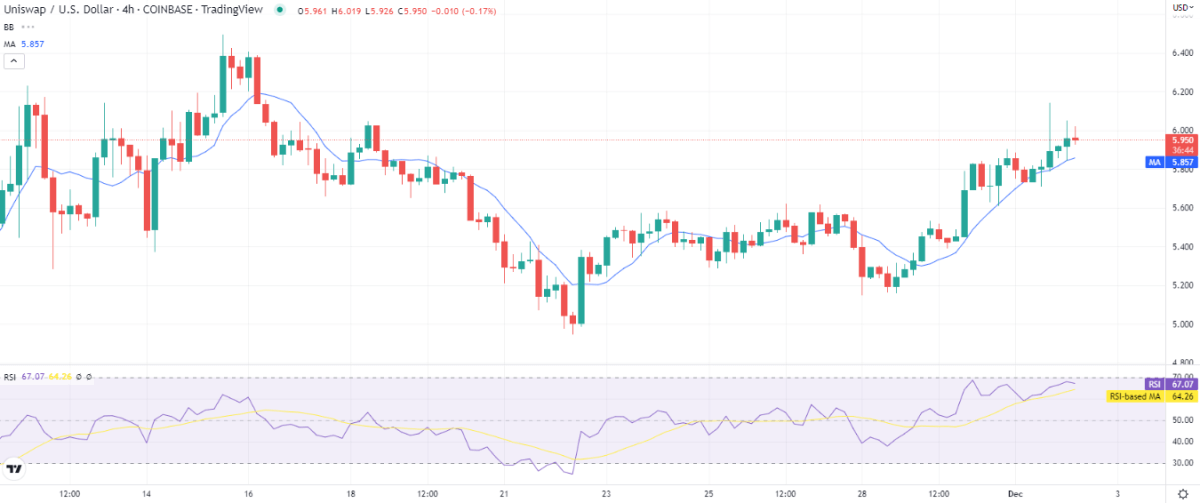
The 4-hour Uniswap price analysis shows bears have countered the bullish momentum again during the last few hours of the trading session, as a sudden decline in price has been observed in the last four hours, and selling pressure seems to be forming at the current price level.

The Bollinger bands are covering more area on the 4-hour chart, which indicates higher volatility and more price movement in the hours ahead. The 20-hour bullish streak has been broken, and since the bulls might be worn out right now, selling pressure could get worse in the hours to come. Due to the upward price movement seen in the earlier hours, the moving average (MA) is also trending below the $5.85 price level. Due to the selling pressure that has caused the RSI curve to slant downward, the RSI is at index 67 in the neutral zone, just shyig away from the overbought zone.
Унисвап анализа цена: Закључак
Given that the price function has been upward for the previous 20 hours, bulls may be worn out, according to the Uniswap price analysis, which reveals the новчић rose high at first but is now spiraling downward. After the correction expires during the trading day, it is anticipated that UNI will continue to rise.
Одрицање од одговорности. Дати подаци нису савет за трговање. Цриптополитан.цом не сноси одговорност за било каква улагања на основу информација на овој страници. Препоручујемо неовисно истраживање и / или консултације са квалификованим стручњаком пре доношења било каквих инвестиционих одлука.
Извор: хттпс://ввв.цриптополитан.цом/унисвап-прице-аналисис-2022-12-02/
