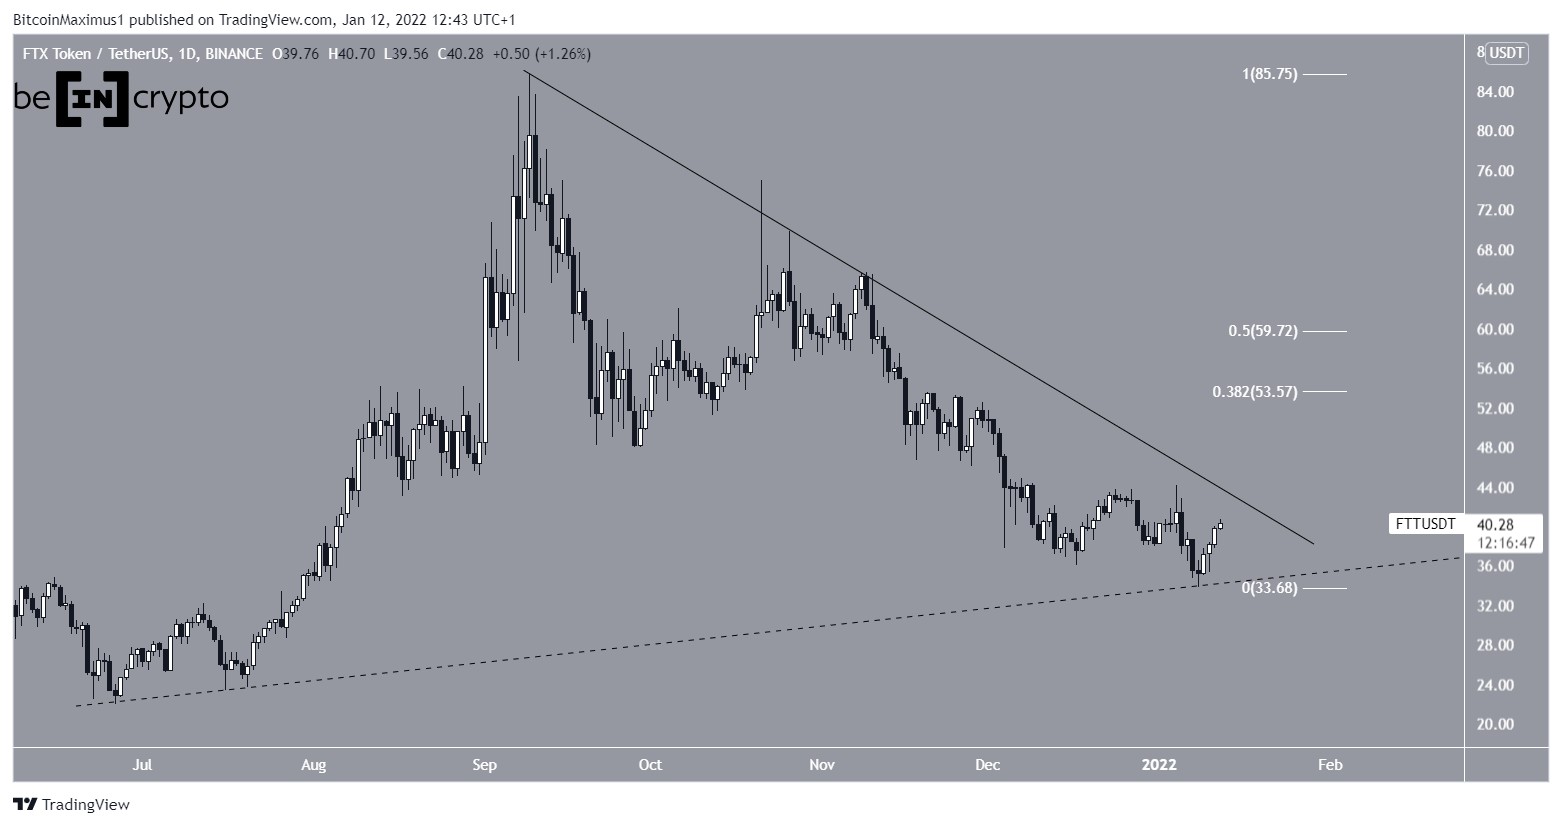
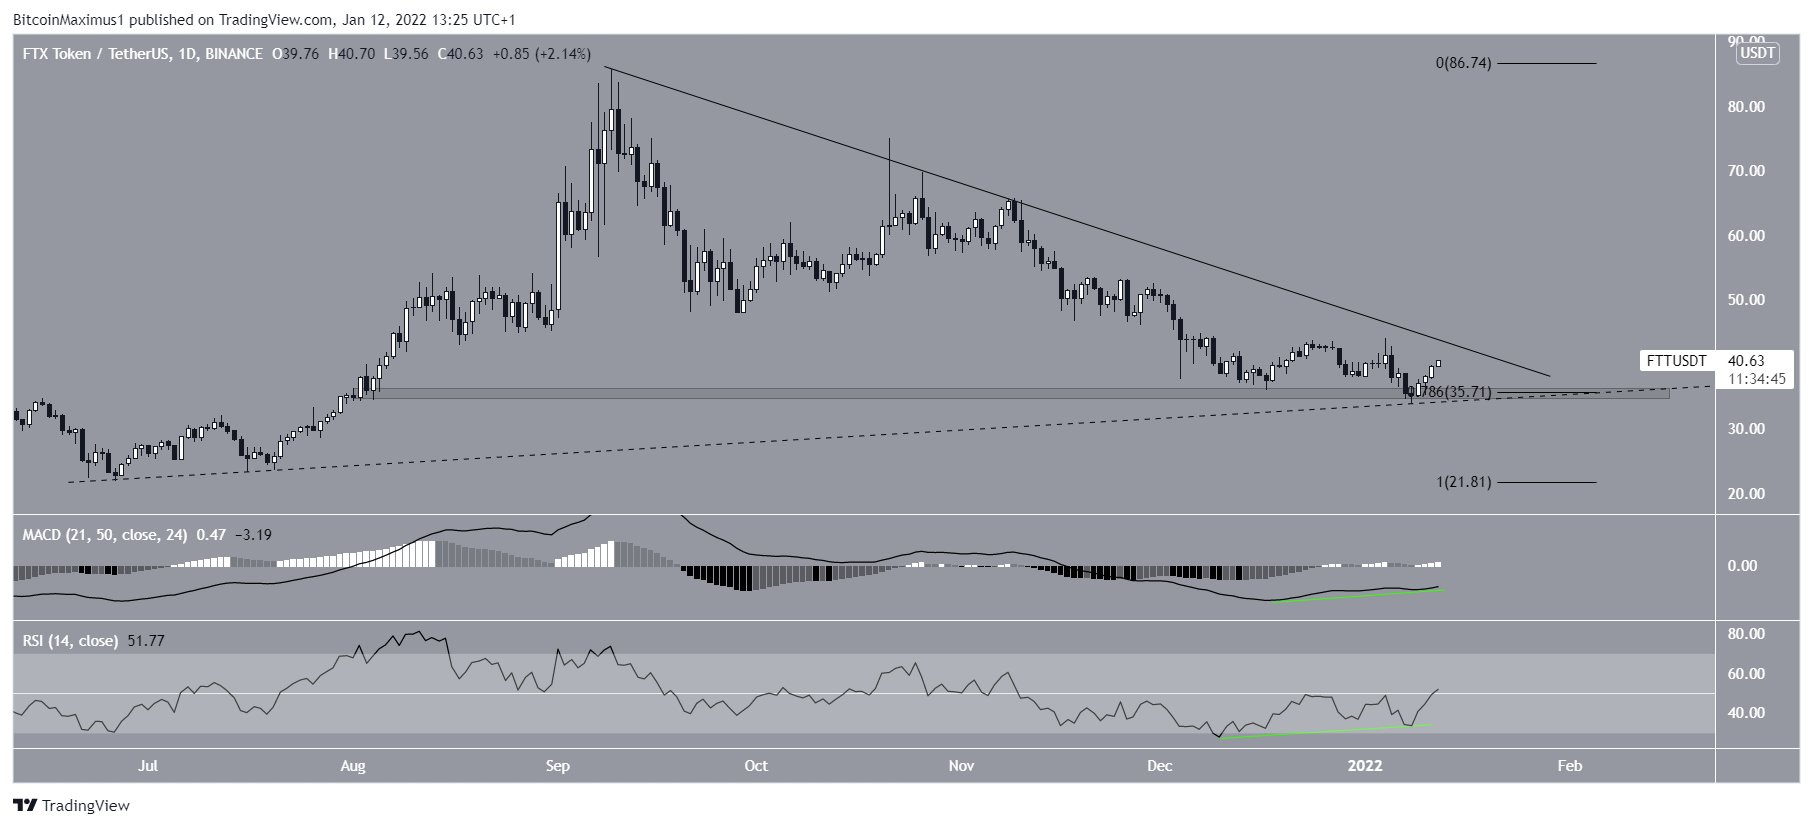
FTX Token (FTT) has bounced at a crucial support area and is showing strong signs of a bullish reversal.
FTT has been decreasing alongside a descending resistance line since reaching an all-time high price of $85.74 on Sept 9. The decrease led to a low of $33.76 on Jan 8.
The token bounced afterwards, potentially validating an ascending support line (dashed), that has been in place since June 26. FTT is approaching the resistance line once more.
If a breakout transpires, the closest resistance would be at $53.5 – $59.7. The area is created by the 0.382-0.5 Fib retracement resistance levels.

Будући покрет
Трговац @0xd0n tweeted a FTT chart, stating that the token has bounced at a crucial support level.

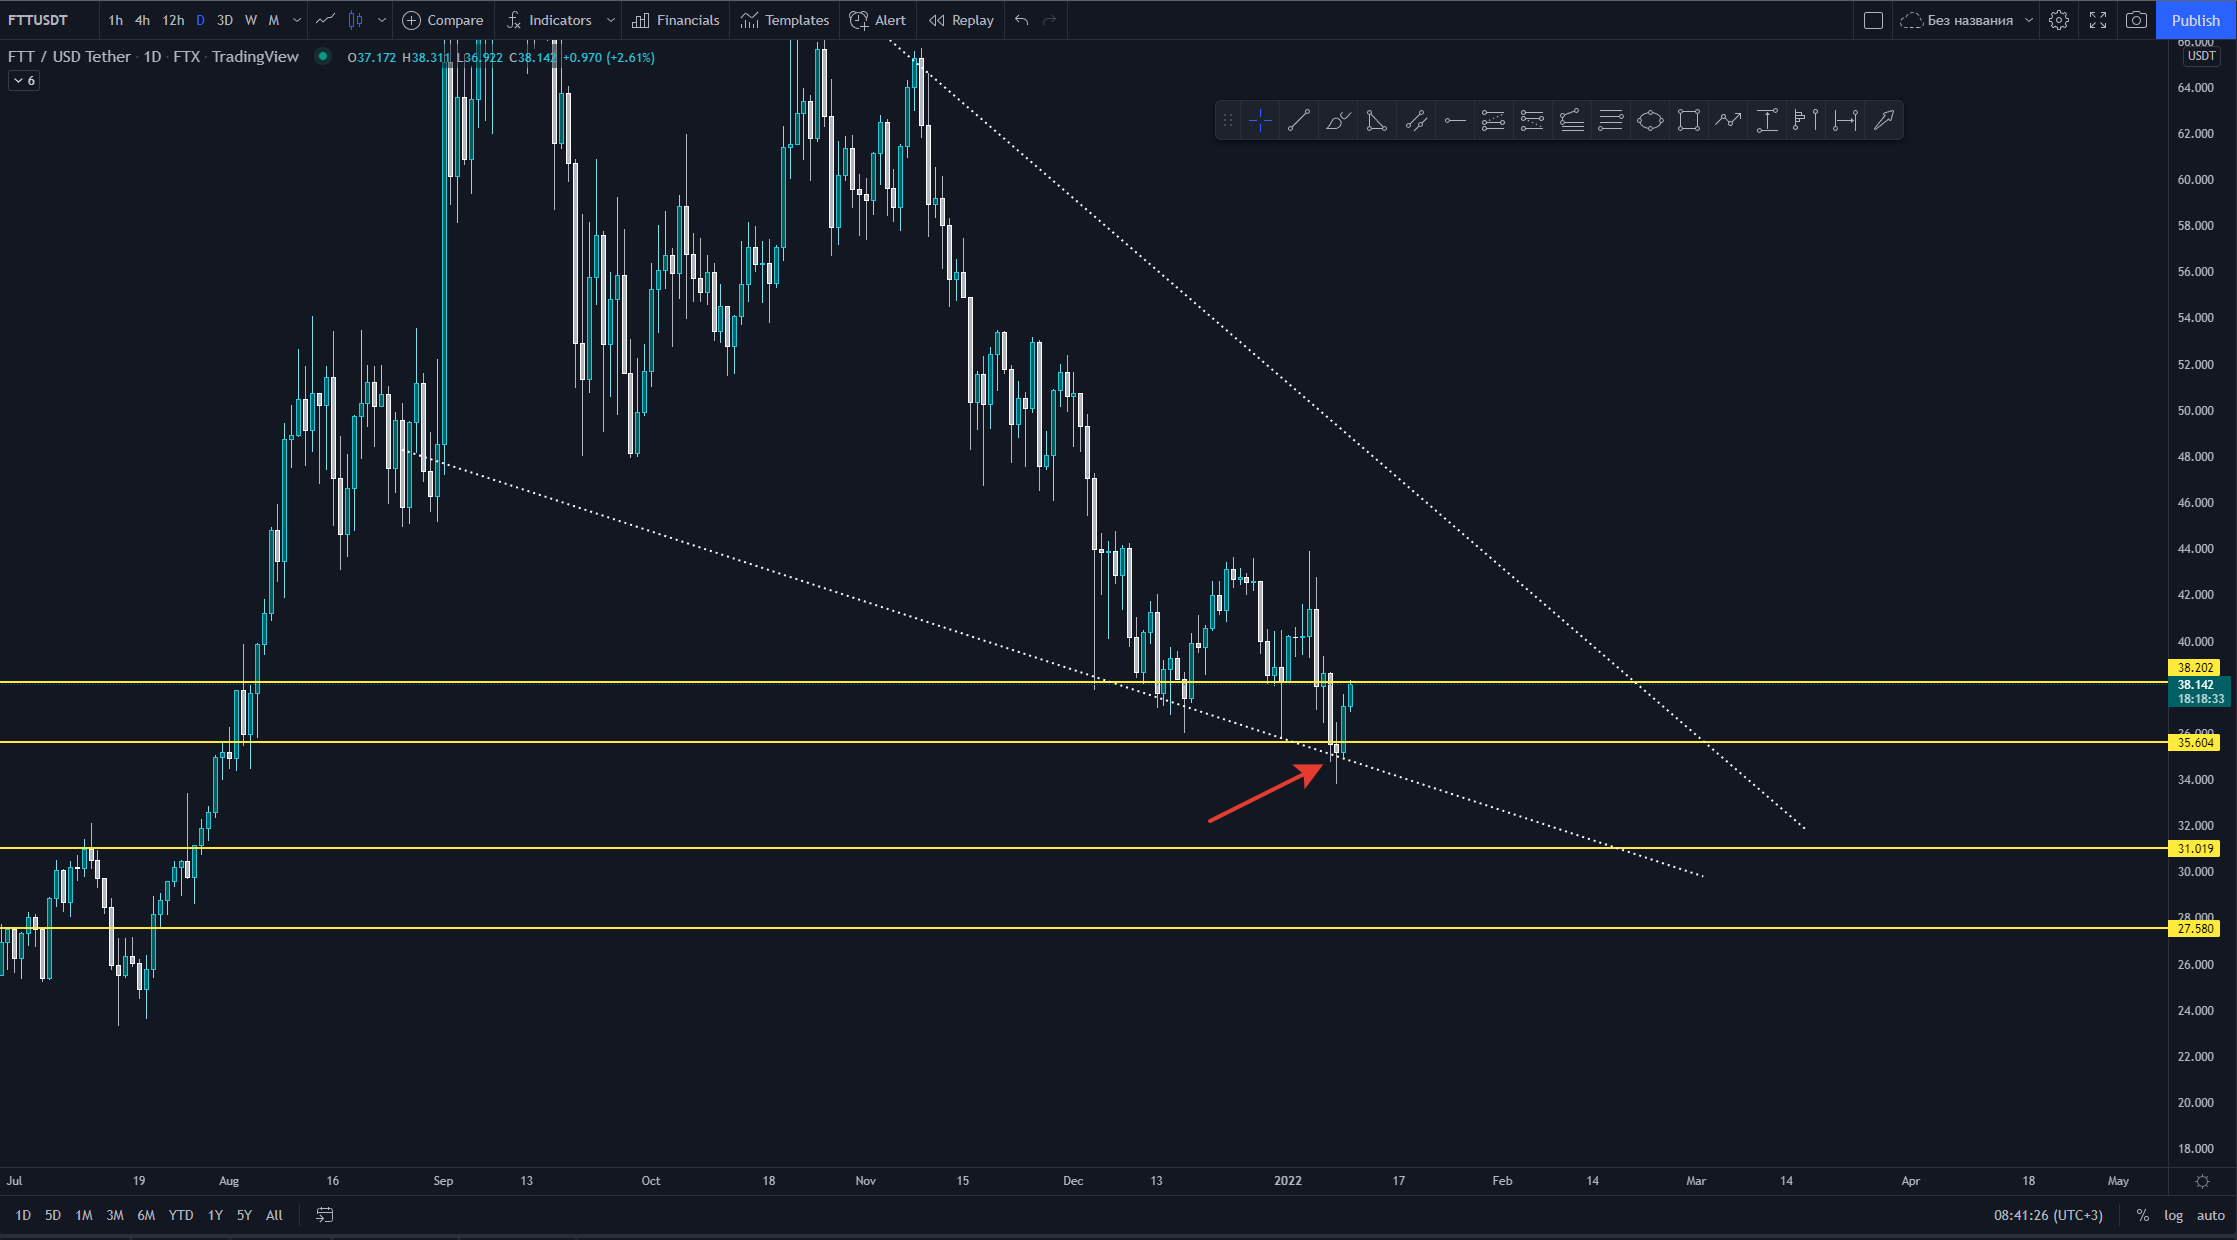
The daily chart shows that FTT bounced right at the 0.786 Fib retracement support level at $35.7. This is also a horizontal support area, further increasing its significance.
Furthermore, technical indicators are decisively bullish.
The MACD, which is created by a short- and a long-term moving average (MA), is moving upwards and is nearly positive. More importantly, it has generated a significant bullish divergence (green line), an occurrence which often precedes bullish trend reversals.
The RSI, which is a momentum indicator, has also generated bullish divergence. In addition to this, it has moved above 50, a level which is considered the threshold for a bullish/bearish trend.
Therefore, an eventual breakout from the resistance line seems likely.

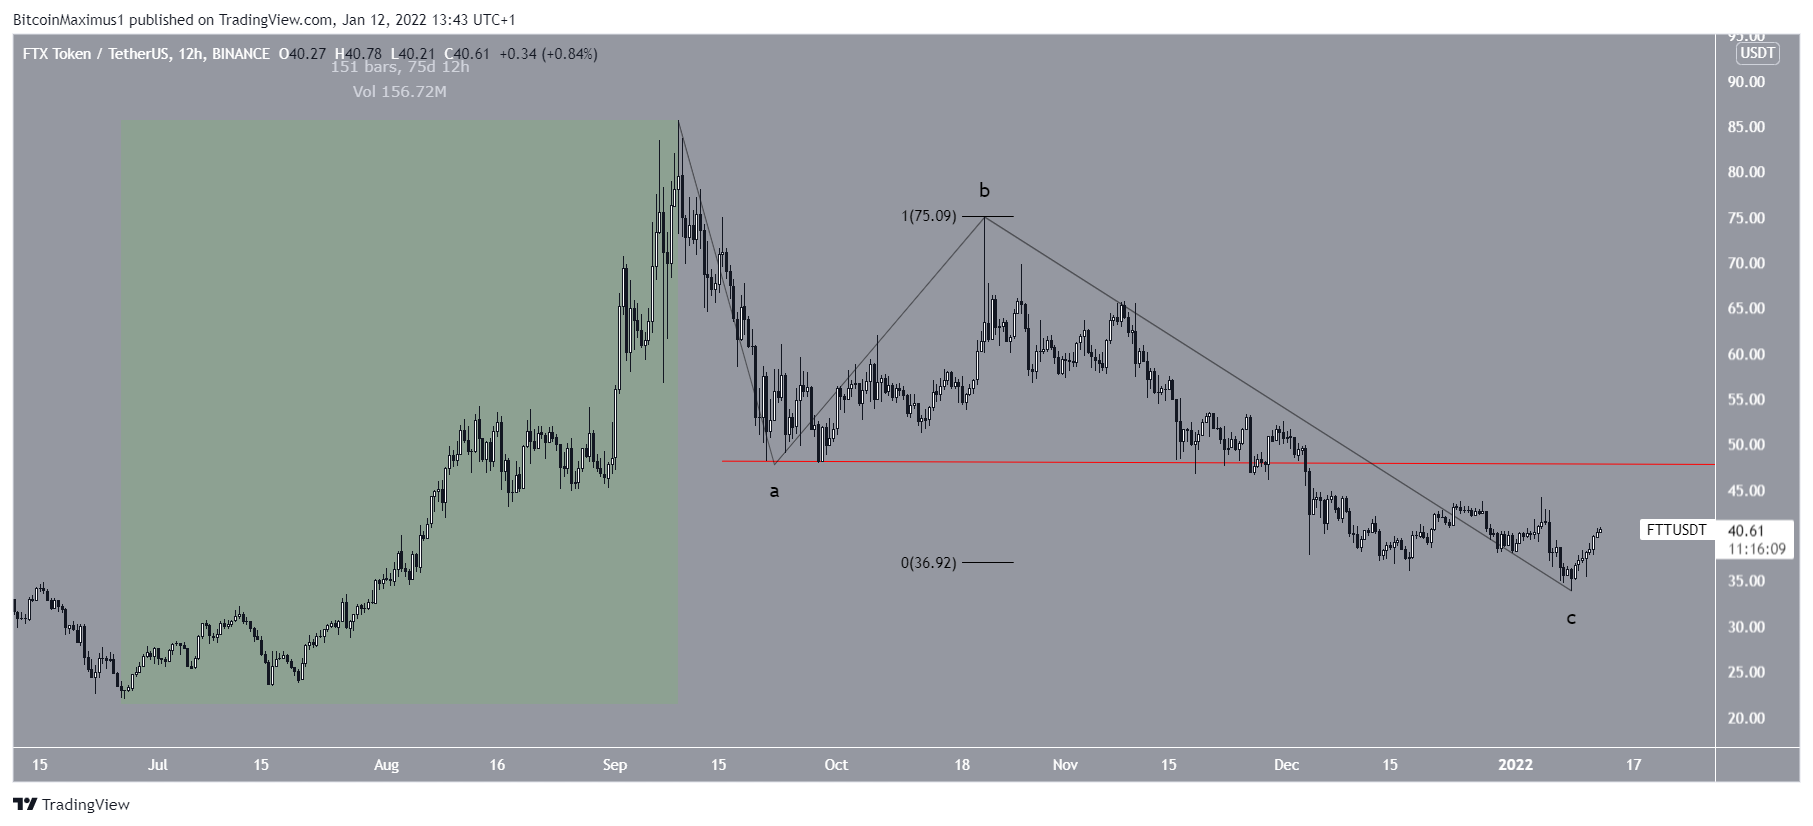
FTT wave count analysis
The decrease ensuing after the Sept 10 all-time high could be an A-B-C corrective structure. There are several reasons for this.
First, the preceding upward movement (highlighted in green) resembles a bullish structure, since it is a five wave upward movement.
Secondly, waves A:C have an exactly 1:1 ratio, which is very common in such structures.
FTT has to move above the Sept 21 lows at $47.8 in order to confirm this count. This would also cause a breakout from the long-term descending resistance line.

За најновије БеИнЦрипто Битцоин (БТЦ) анализа, кликните овде.
Одрицање од одговорности
Source: https://beincrypto.com/ftx-token-ftt-increases-by-25-after-january-low/