тржиште is mainly trading sideways after a recent correction.
ОКБ / УСД
The rate of OKB keeps rising by around 5% over the last 24 hours.

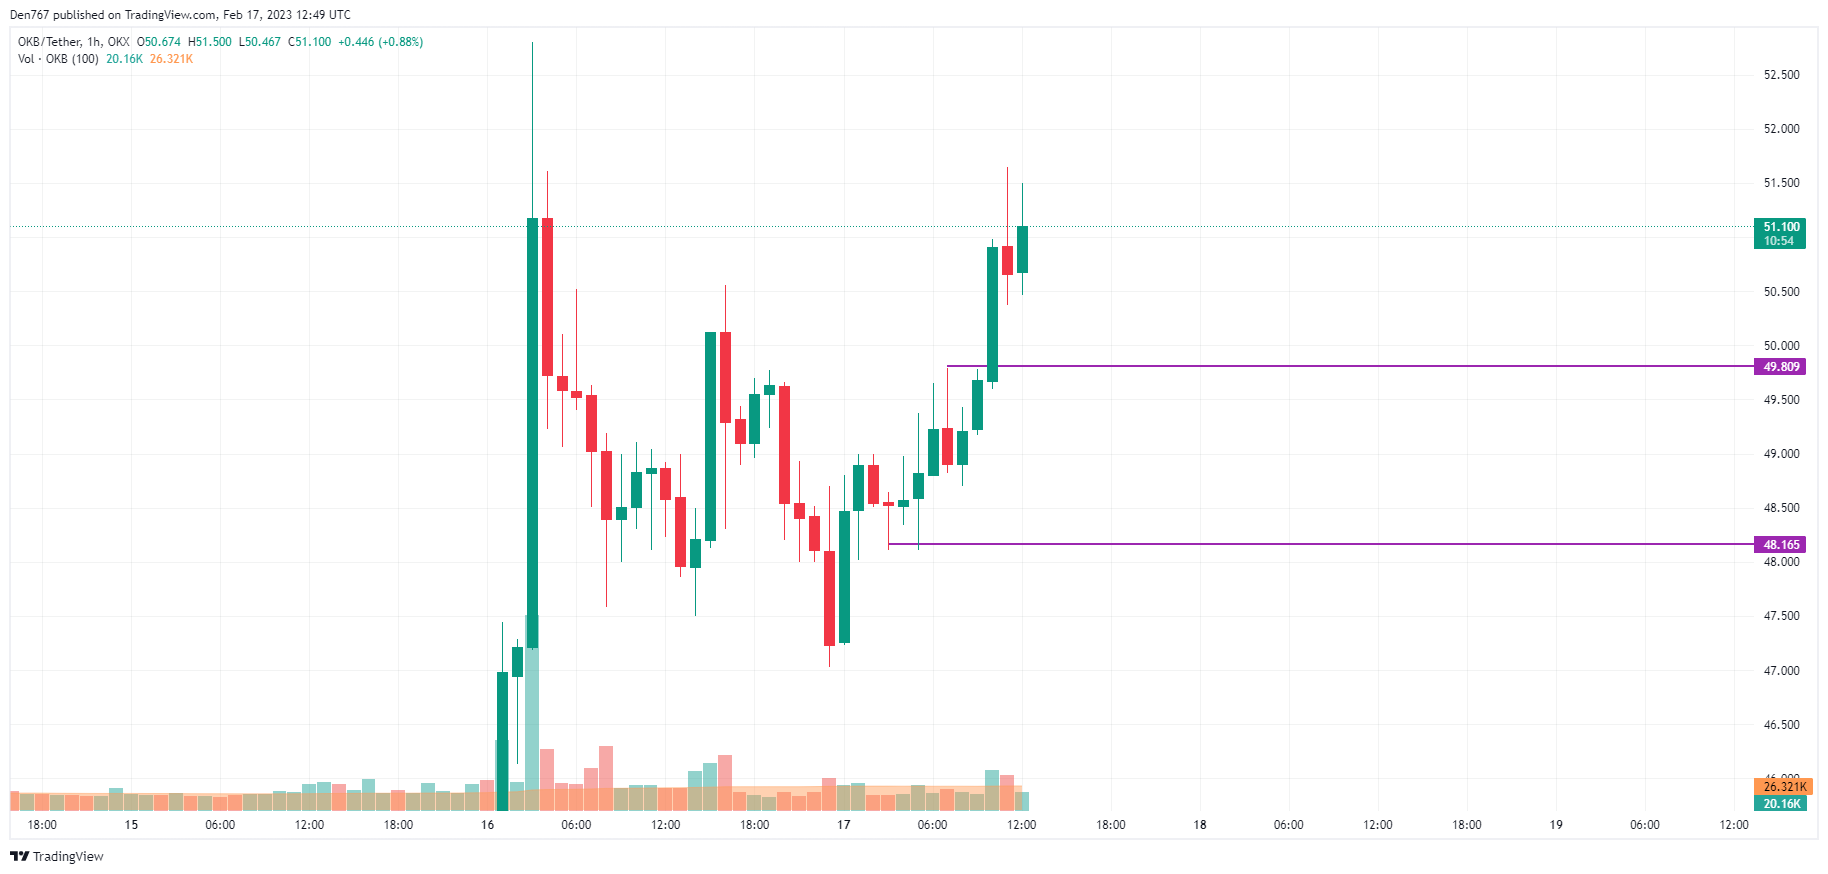
On the hourly chart, the price of OKB has broken the local resistance at $49.80, which means that bulls remain more powerful than bears. From another point of view, the altcoin has passed most of its daily ATR, and sideways trading in the area of $51-$51.50 is the more likely scenario.
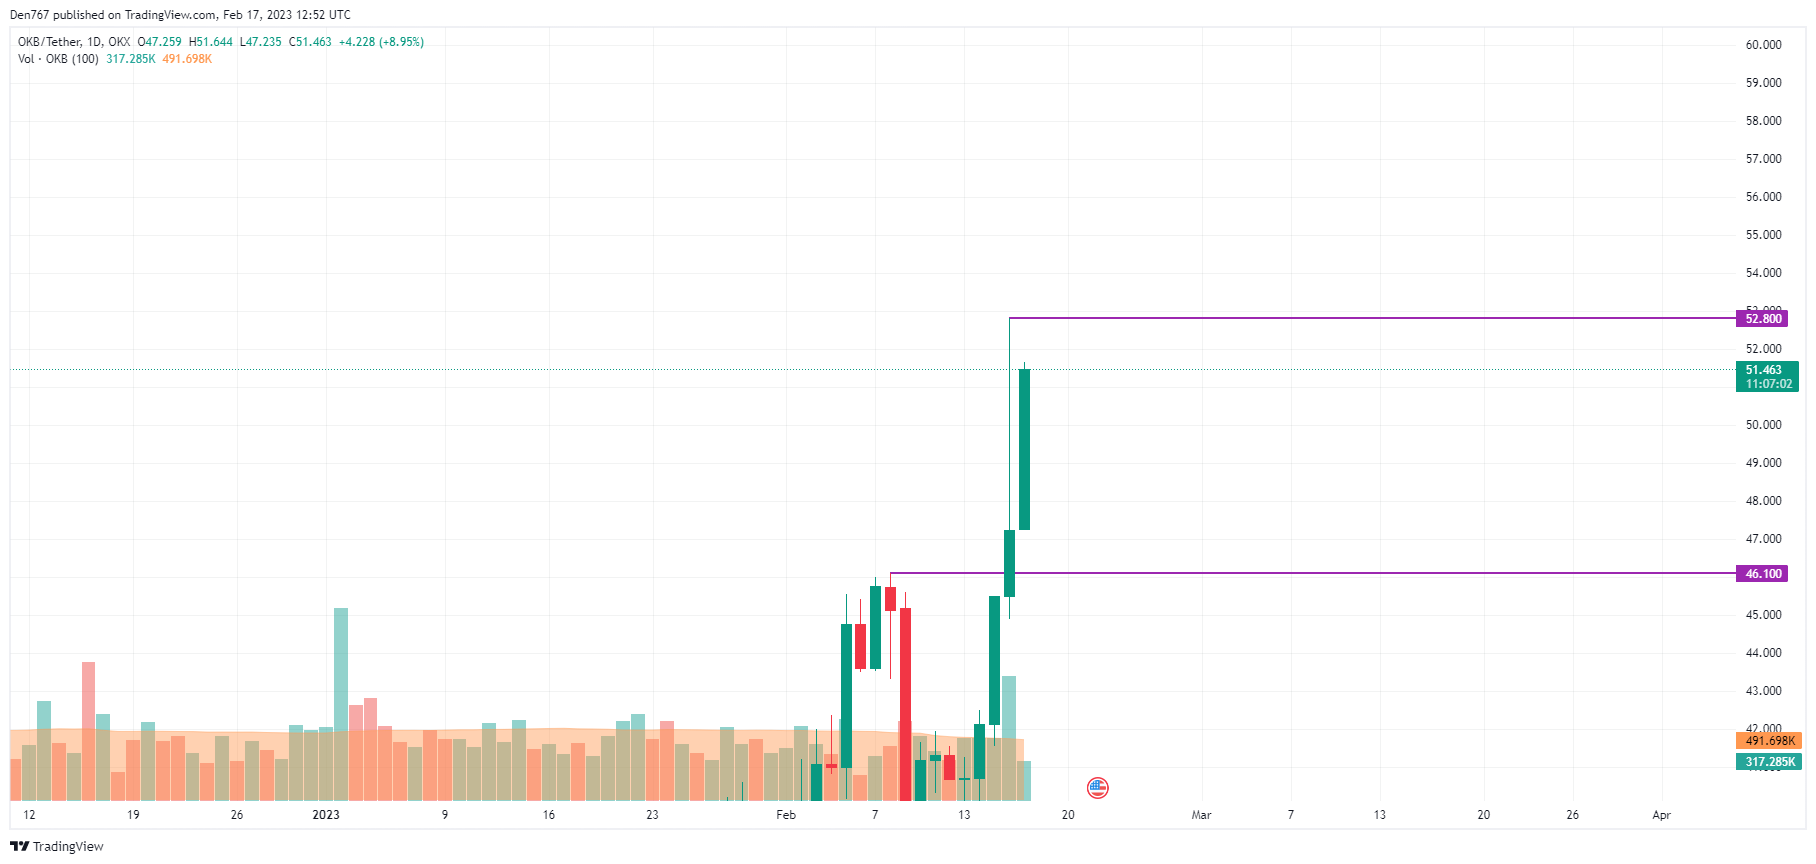
On the daily time frame, traders should pay attention to the mark of $52.80. If the bar closes near it, there are chances to see a breakout, followed by a blast to the $55 zone. Thus, the volume is growing, which means that bulls are ready to keep the midterm bull run going.
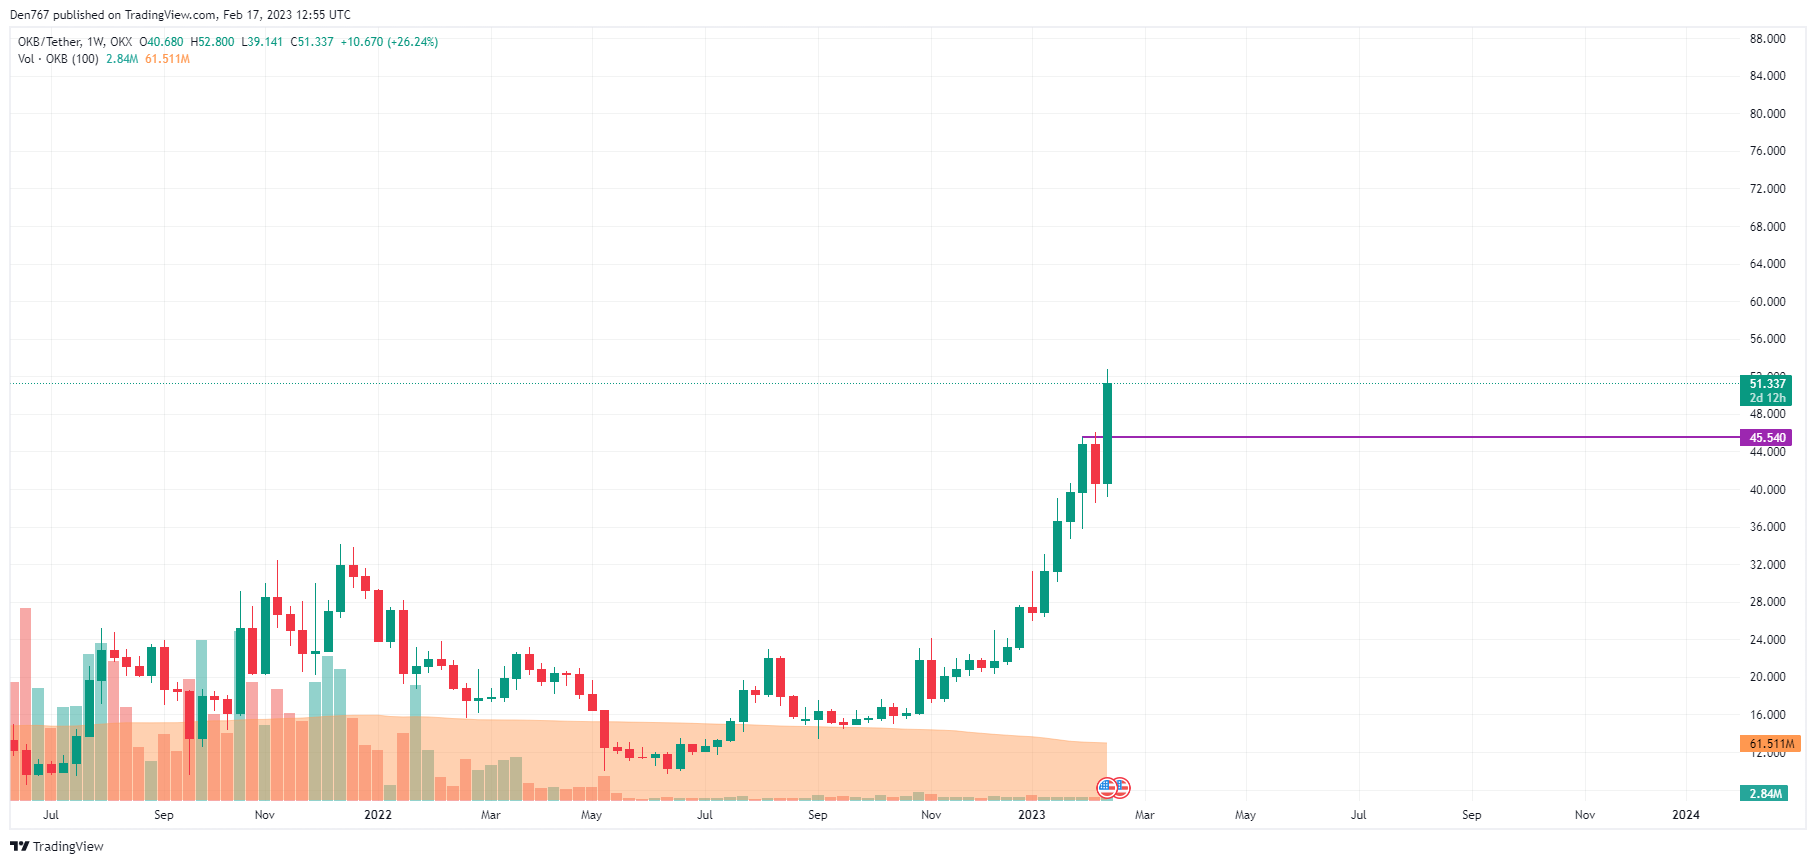
A similar situation can be seen on the weekly time frame, as the price has broken all possible levels and is setting new peaks now. Currently, the zone of $50 plays an important role for bulls in terms of further growth.
If buyers can hold the rate above that mark, the upward move may continue to $60.
OKB is trading at $51.479 at press time.
Source: https://u.today/okb-price-analysis-for-february-17