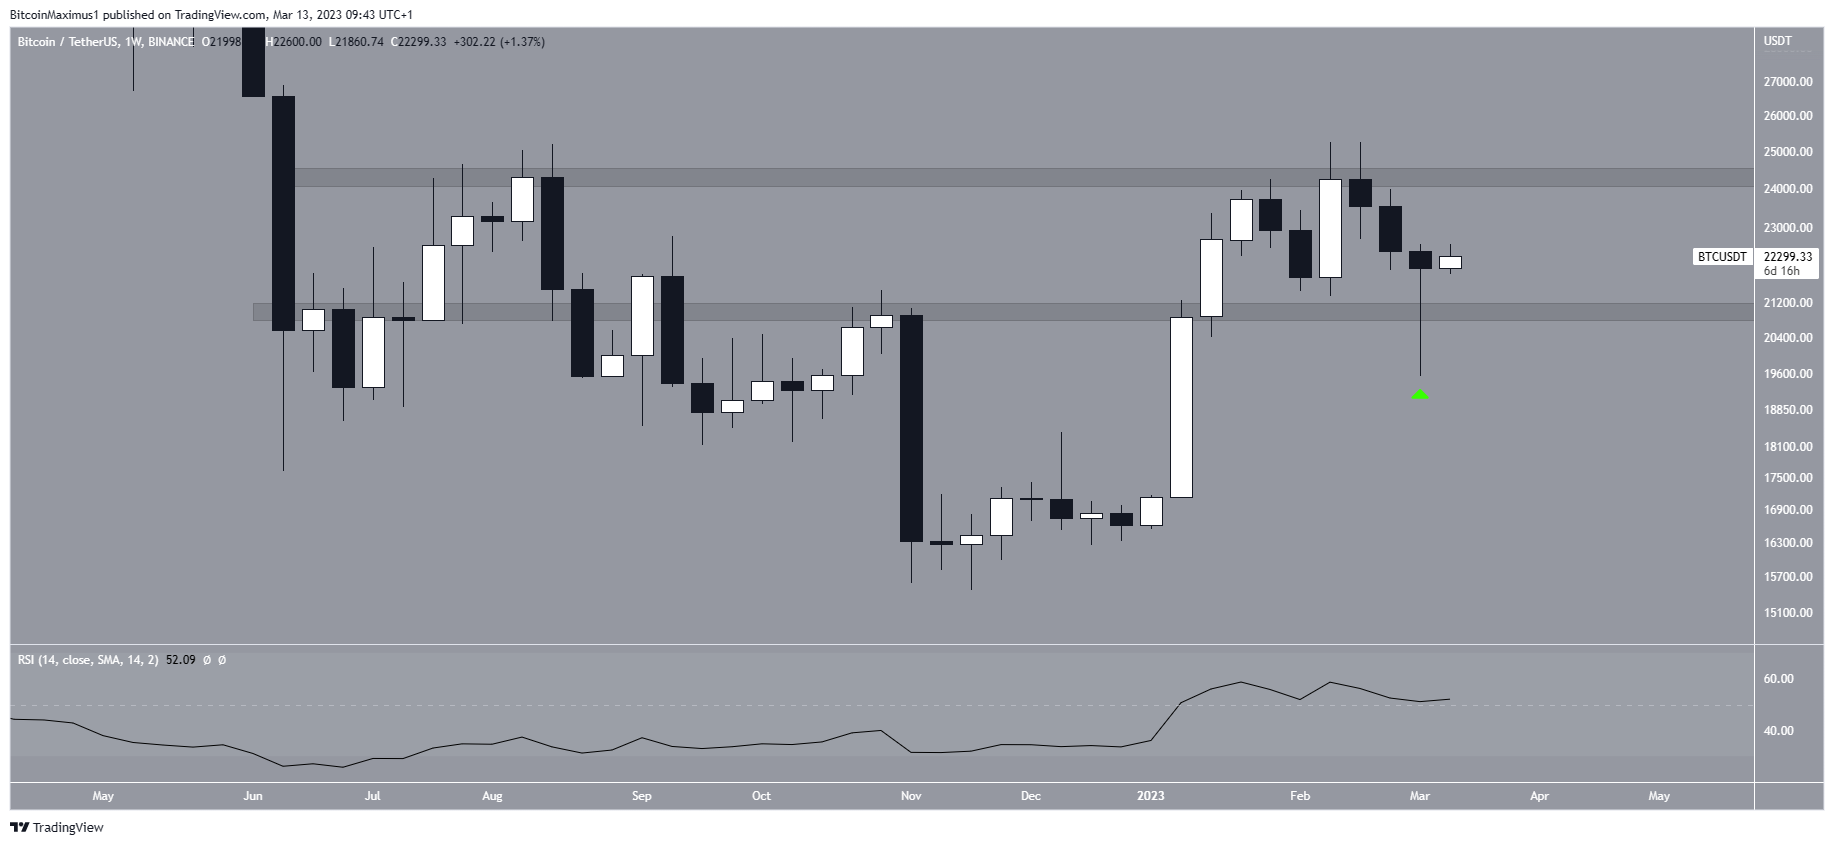
Bitcoin (BTC) price increased significantly over the weekend, saving a potential breakdown in the process. However, the future trend’s direction has yet to be determined.
Last week, the Bitcoin price created a massive, long lower wick (green icon). Even though the close is slightly bearish, the movement can be considered bullish due to the length of the wick.
Moreover, the wick affected two other bullish structures.
Firstly, it saved a potential breakdown from the $21,000 horizontal area. Now, the area is expected to provide support once more. Secondly, it caused the РСИ to remain above 50. This is considered a sign of a bullish trend.

Therefore, while the trend is still neutral due to the range, several bullish signs make a breakout more likely.
A breakout from the top of the range could lead to an increase toward $28,000. On the other hand, a breakdown could lead to a fall toward $17,000.
Bitcoin (BTC) Price Gives Mixed Signs
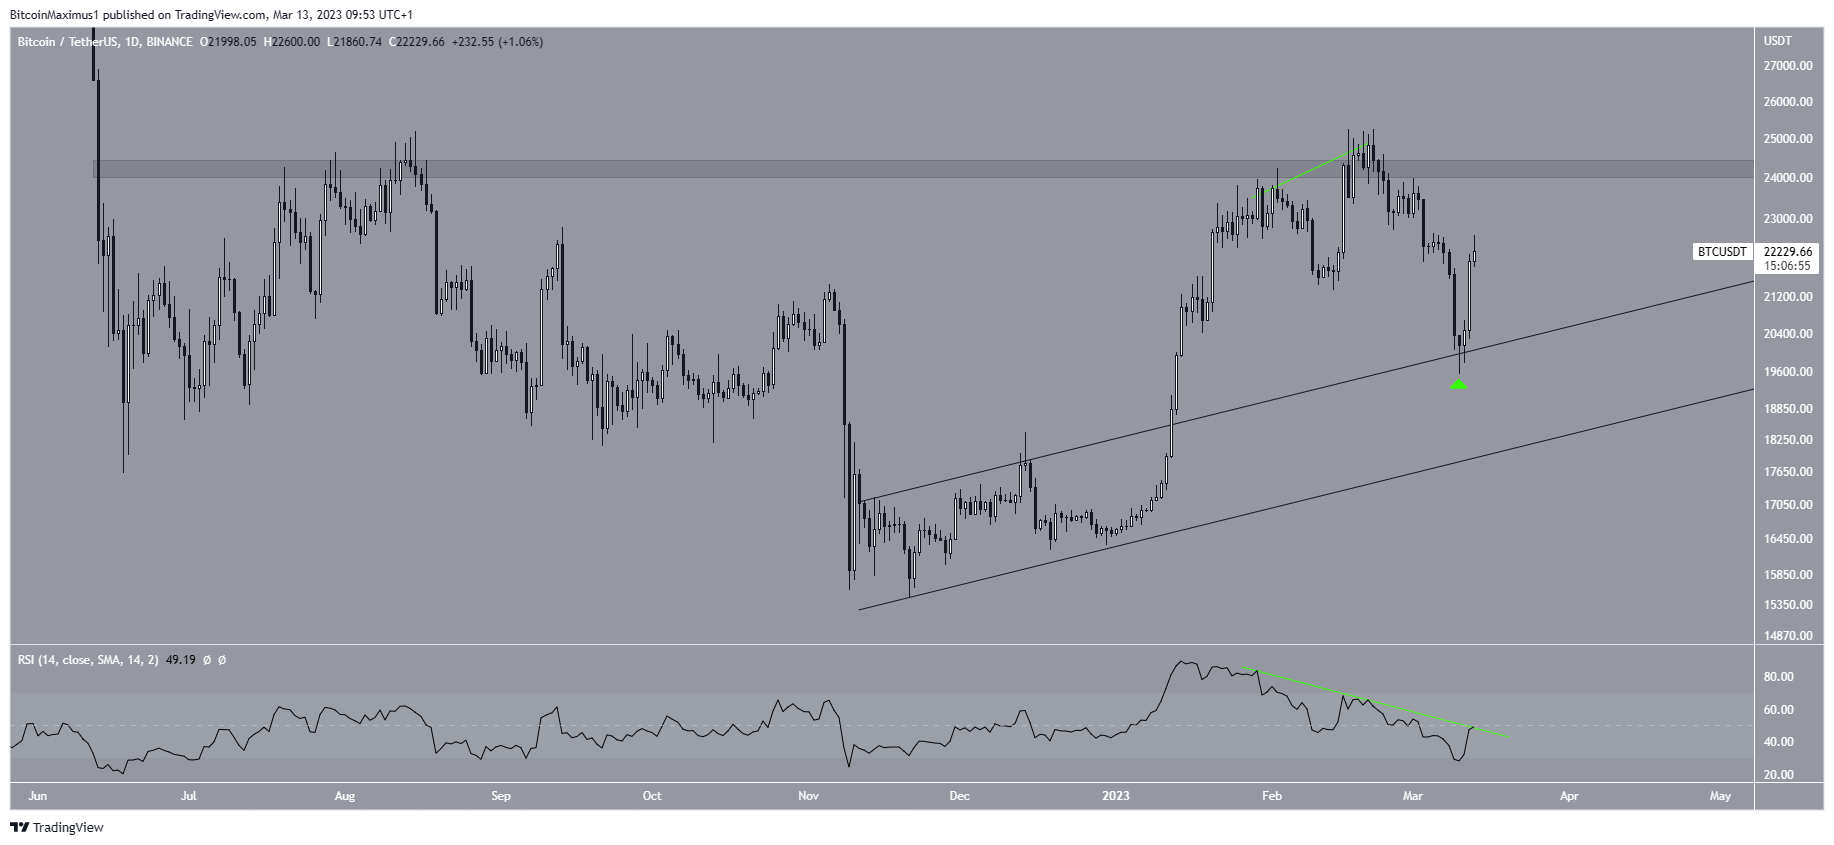
Сличан недељни графикон, the daily one provides some mixed signs. The BTC цена bounced on March 10, validating the previous channel as support. It created a massive bullish candlestick on March 12.
Међутим, дневни РСИ has yet to break out from its bearish divergence trend line (green line). Moreover, it is still below 50.
Therefore, the trend cannot be considered bullish yet.
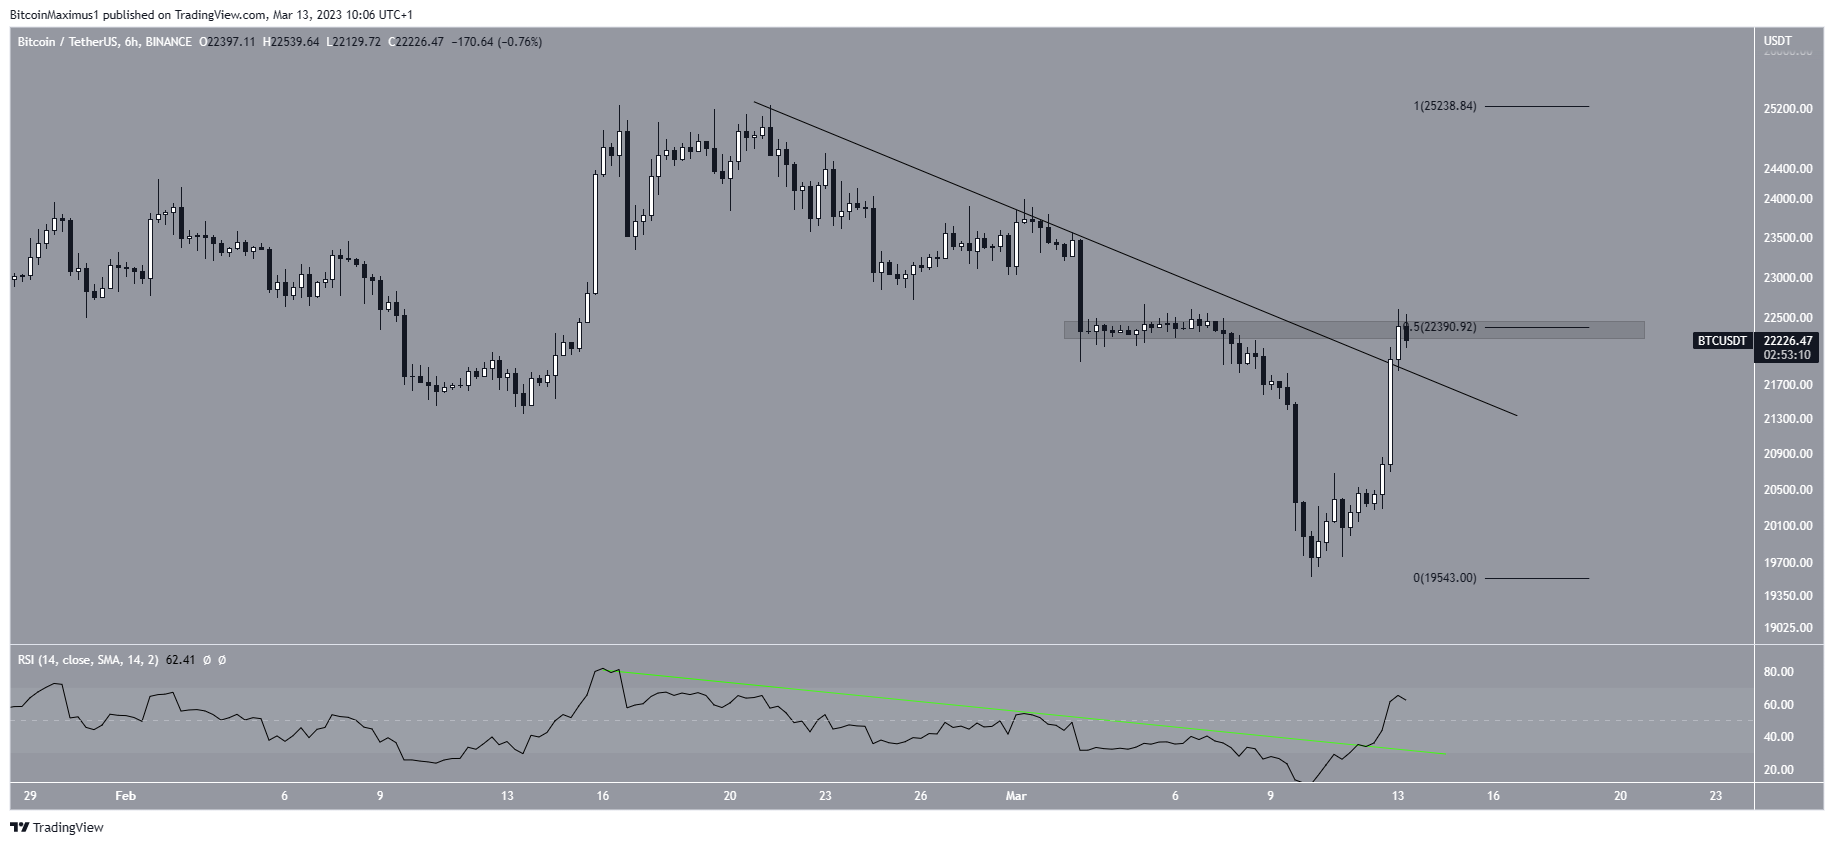
Next, the short-term six-hour chart shows that the Bitcoin цена broke down from a descending resistance line. This followed an RSI breakout and movement above 50.
Now, the BTC price trades at the 0.5 Фиб retracement resistance level at $22,400. Whether it breaks out or gets rejected could determine the future trend.
Wave Count Analysis: Relief Rally or Bullish Reversal?
There are two potential counts in play. The bullish one suggests that BTC has just completed a fourth-wave pullback. If so, it has begun the fifth and final wave of an upward movement that will take it toward $28,000.
The count would be invalidated by a fall below the wave one high (red line) at $18,387.
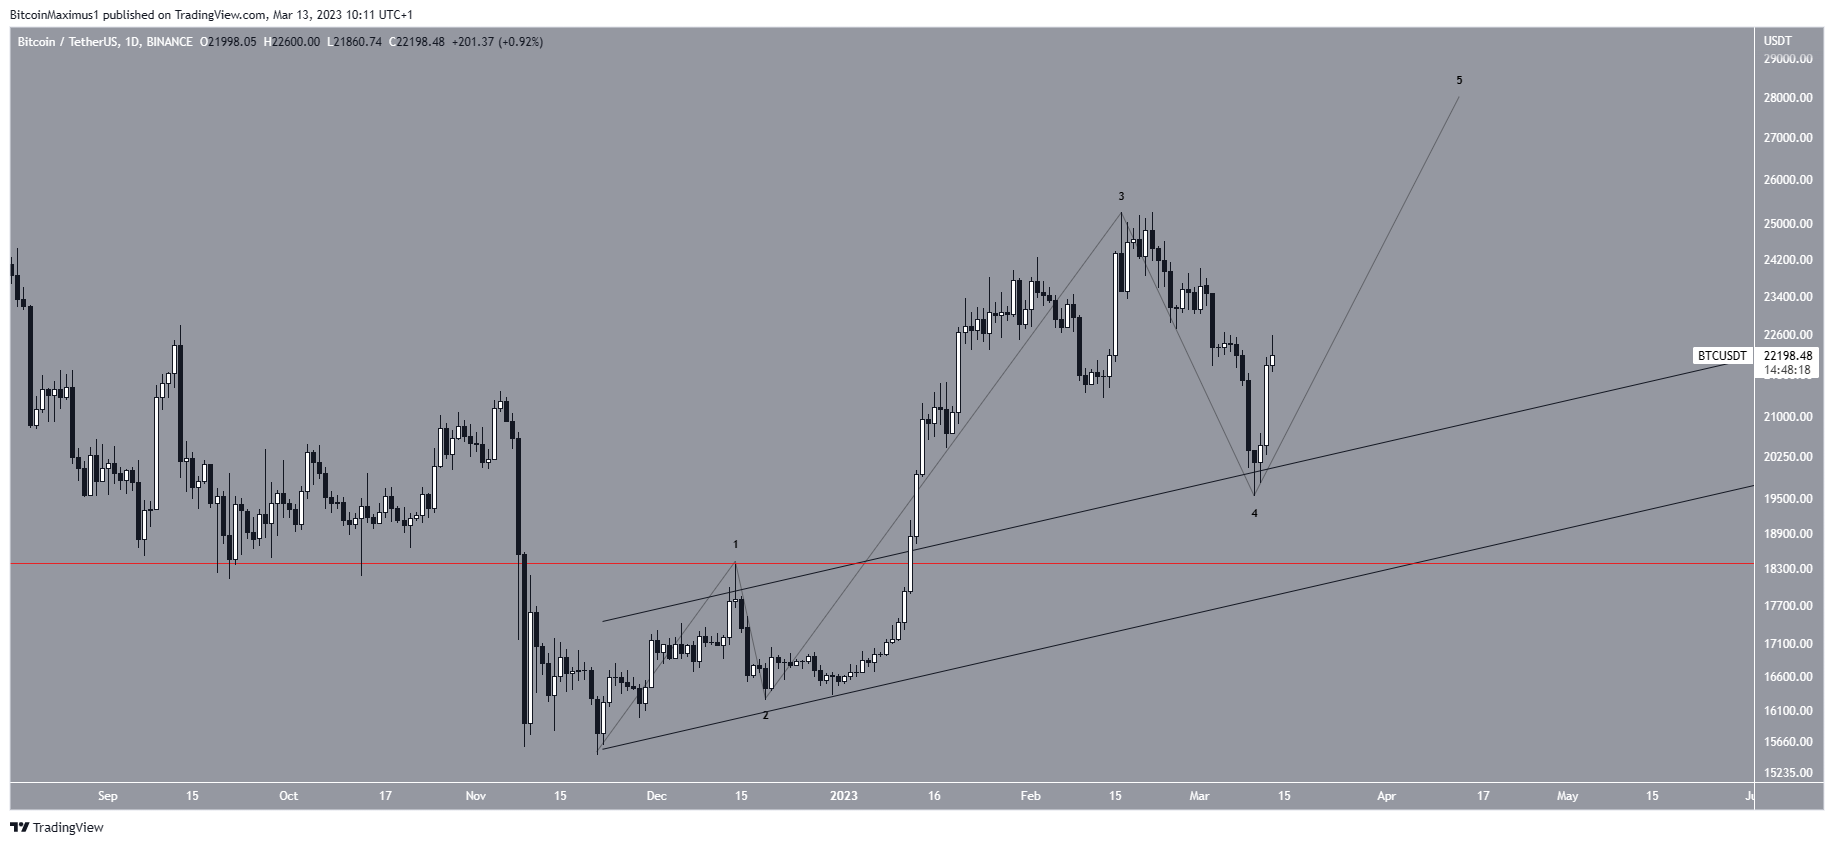
The bearish count suggests that BTC is in a corrective wave two and will decrease again. However, the sub-wave count (red) in wave one is extremely unusual. As a result, the first count is more likely. The bearish count would be invalidated by an increase above the previous highs at $25,250.
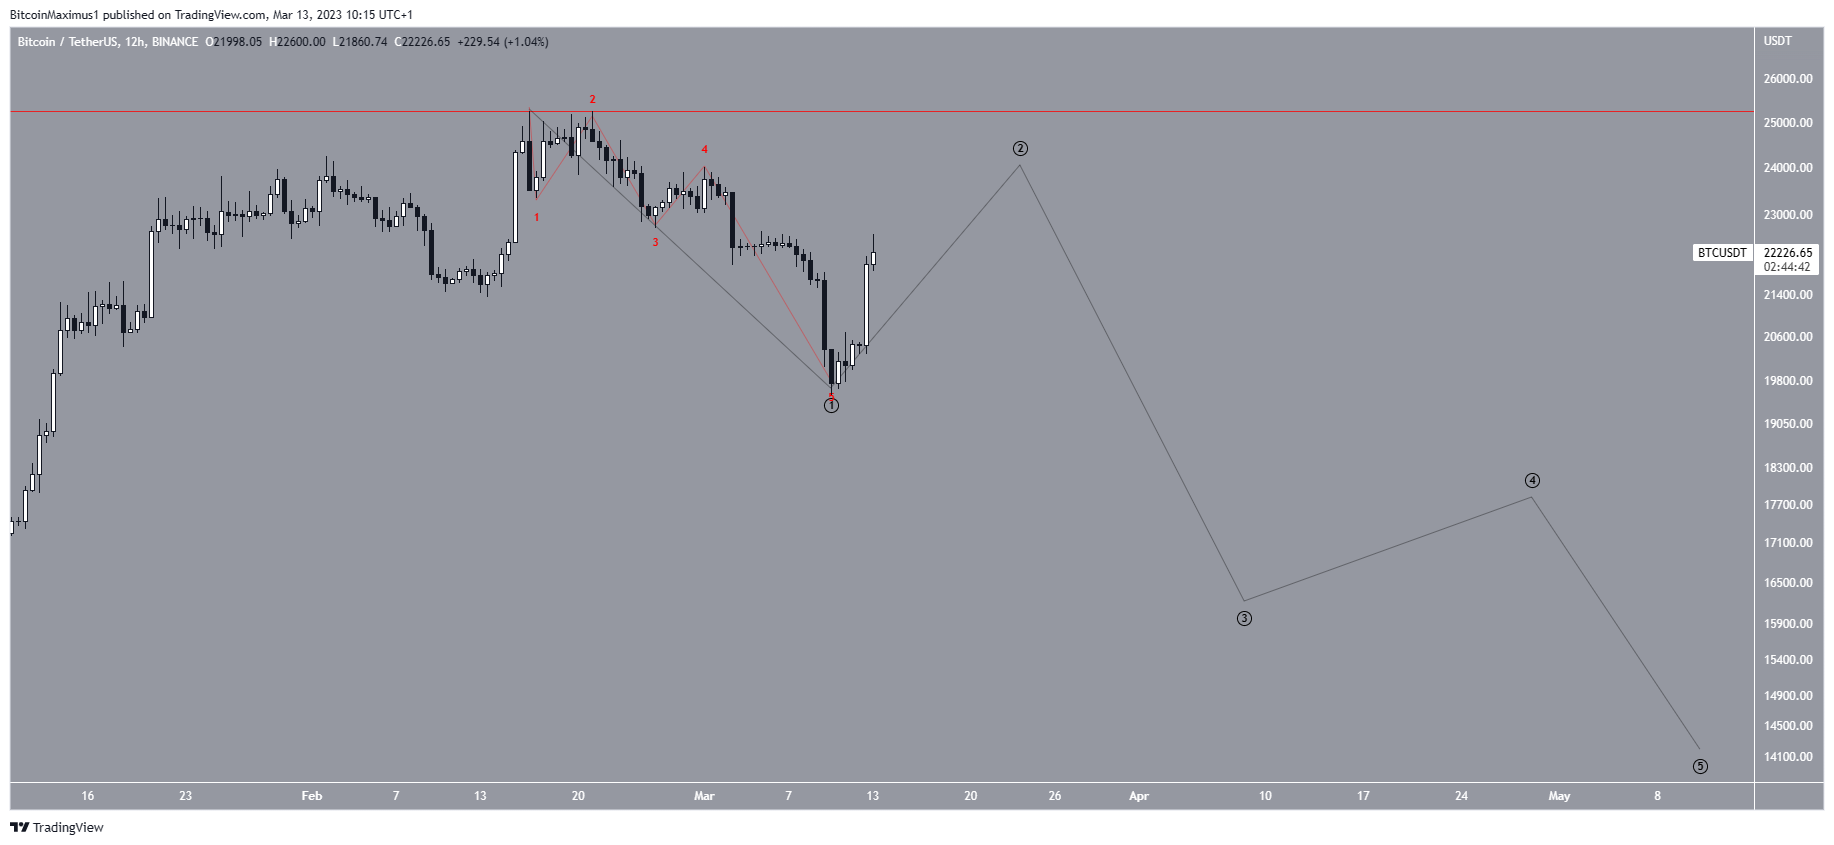
To conclude, the future BTC trend is still undetermined. Whether the price falls below $18,387 or increases above $25,250 will help determine the future movement. The former would lead to lows below $15,000 while the latter could lead to an increase toward $28,000.
За најновију анализу крипто тржишта БеИнЦрипто, clицк хере.
Одрицање од одговорности
БеИнЦрипто настоји да пружи тачне и ажурне информације, али неће бити одговоран за чињенице које недостају или нетачне информације. Придржавате се и разумете да треба да користите било коју од ових информација на сопствени ризик. Криптовалуте су веома нестабилна финансијска средства, па истражите и доносите сопствене финансијске одлуке.
Source: https://beincrypto.com/bitcoin-btc-price-bounces-back/