Објављено пре 8 сати
A V-shaped recovery initiated from the June bottom support of $3.36 pushed the УНИ цена 190% higher and formed a local top at $9.82. However, after a nearly three-week attempt to surpass this resistance, the bullish momentum exhausted and triggered a significant price correction.
Кључне тачке из УНИ анализе:
- The ongoing correction is plunged to the 0.5 Fibonacci retracement level
- The daily RSI slope dives deeper into bearish territory, indicating increasing fear in market participants
- 24-часовни обим трговања Унисвап токеном је 178.2 милиона долара, што указује на повећање од 22.3%.
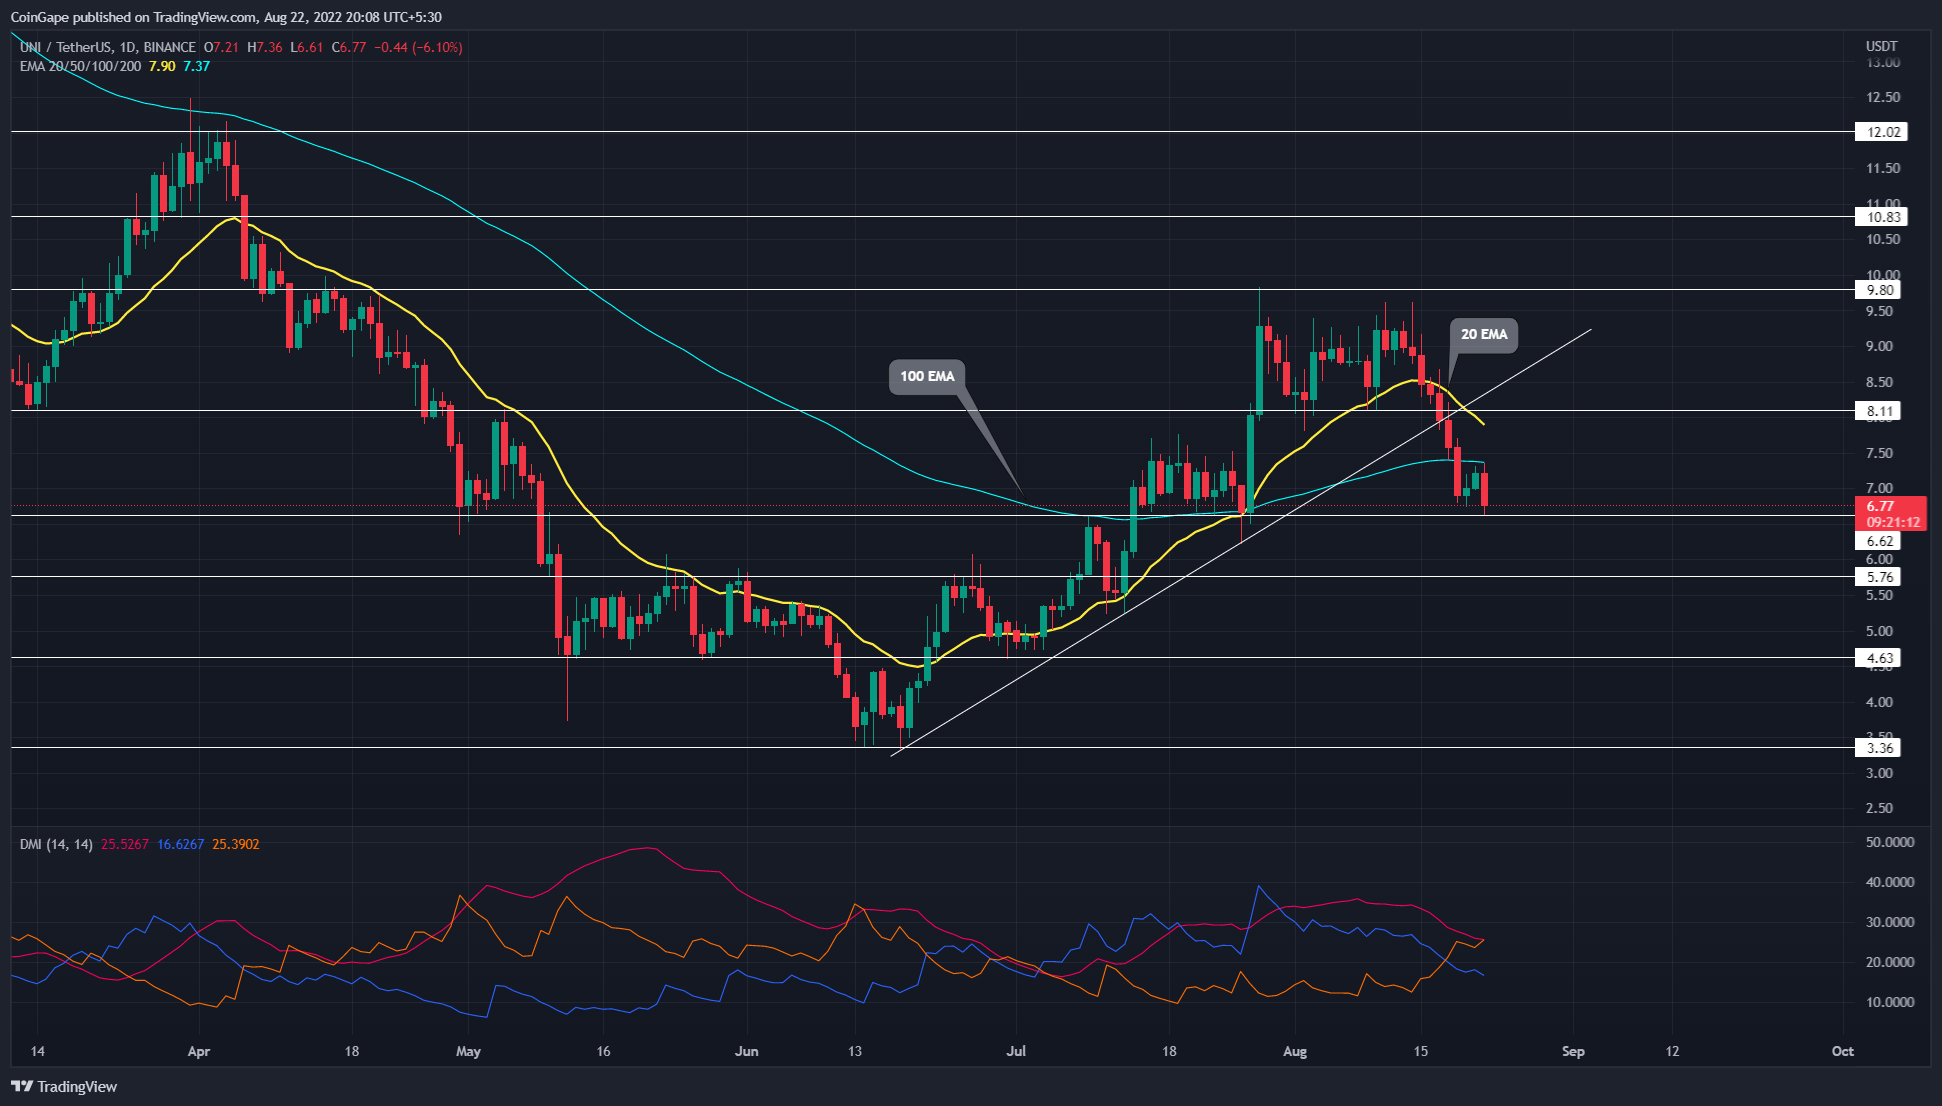 Извор-Традингвиев

Last week, the increased selling activities in the crypto market resulted in a sharp fall in most of the altcoins. The UNI price action depicts a similar trend resulting in the fallout of multiple support levels.
The Uniswap token market price plunged after failing to sustain above the 20 days EMA and facing constant rejection from the $9.50 resistance level. That downtrend last week accounts for a price dump of 26% resulting in the fallout of a long-coming support trendline.
The combined support of $6.6 and 0.5 FIB cushions the falling prices for a 4.5% recovery over the weekend. However, the prevailing bear trend gains momentum with the start of a new week resulting in a 5.2% price drop.
With the increased selling pressure, the UNI prices may soon break below the $6.75 support level and test the next horizontal level of $5.90. The downtrend will account for a 12% decrease in market value and endanger the bullish dominance at the psychological mark of $5.0.
However, if buyers manage to contain the selling pressure, a sideways trend above the $6.75 horizontal level can be expected. Moreover, in the best-case scenario, a bullish reversal retesting the $8.0 breakout is also possible.
Технички индикатор
ЕМАс: the coin price nosedive below the trend-defining 100-day EMA indicates the bears are in control. Moreover, the 20-day EMA flipped to viable resistance level.
ДМИ индикатор: the DI lines give a bearish crossover with a drop in the ADX line, reflecting weakness in the previous bullish momentum. However, a positive turnaround in the ADX line will represent an increase in bearish trend momentum.
- Нивои отпора - $8.11, $9.8
- Нивои подршке су $6.62 и $5.76
Представљени садржај може садржати лично мишљење аутора и подложан је тржишним условима. Истражите тржиште пре него што инвестирате у крипто валуте. Аутор или публикација не сноси никакву одговорност за ваш лични финансијски губитак.
Source: https://coingape.com/markets/is-uni-price-recovery-possible-at-50-retracement-level/